Predict cell types with the scAdam model hub#
scAdam is specifically developed for annotating cell types, especially focusing on rare cell types that may be underrepresented in the dataset.
Advantages
scAdam not only detects all cell types in any test dataset but also generates reproducible results, which is an important aspect for reliable biological interpretation.
It enables multi-level annotation by allowing the researchers to extract individual cell types for targeted investigations.
Unknown cell type identification makes it possible to identify new cell types that are absent from the data on which the scAdam model was trained.
Integration with Other Tools: scAdam is part of a bigger toolkit that includes other tools, such as scEve for surface protein prediction and scNoah for benchmarking, making it a comprehensive solution for single-cell analysis.
[1]:
# Python packages
import warnings
warnings.simplefilter('ignore')

import anndata
import scanpy as sc
import scparadise
import numpy as np
import pandas as pd
import matplotlib.pyplot as plt

sc.set_figure_params(dpi = 120)
Dataset recommendations#
Our models are trained on shifted logarithm-normalized data.
To ensure proper use of the models, apply the following preprocessing steps:
sc.pp.normalize_total(adata, target_sum=None)
sc.pp.log1p(adata)
PBMC#
[2]:
# Load dataset from 10x Genomics
url = "https://cf.10xgenomics.com/samples/cell-exp/6.1.0/10k_PBMC_3p_nextgem_Chromium_X/10k_PBMC_3p_nextgem_Chromium_X_filtered_feature_bc_matrix.h5"
adata = sc.read_10x_h5("dataset.h5", backup_url = url)
adata.var_names_make_unique()
adata
100%|██████████████████████████████████████████████████████████████████████████████| 37.7M/37.7M [00:04<00:00, 9.28MB/s]
[2]:
AnnData object with n_obs × n_vars = 11996 × 36601
    var: 'gene_ids', 'feature_types', 'genome'
[2]:
# Load dataset from 10x Genomics
url = "https://cf.10xgenomics.com/samples/cell-exp/6.1.0/10k_PBMC_3p_nextgem_Chromium_X/10k_PBMC_3p_nextgem_Chromium_X_filtered_feature_bc_matrix.h5"
adata = sc.read_10x_h5("dataset.h5", backup_url = url)
adata.var_names_make_unique()
adata
[2]:
AnnData object with n_obs × n_vars = 11996 × 36601
    var: 'gene_ids', 'feature_types', 'genome'
QC#
Standard quality control from scanpy tutorial
[3]:
# mitochondrial genes, "MT-" for human, "Mt-" for mouse
adata.var["mt"] = adata.var_names.str.startswith("MT-")
# ribosomal genes
adata.var["ribo"] = adata.var_names.str.startswith(("RPS", "RPL"))
# hemoglobin genes
adata.var["hb"] = adata.var_names.str.contains("^HB[^(P)]")
[4]:
sc.pp.calculate_qc_metrics(
    adata, qc_vars=["mt", "ribo", "hb"], inplace=True, log1p=True
)
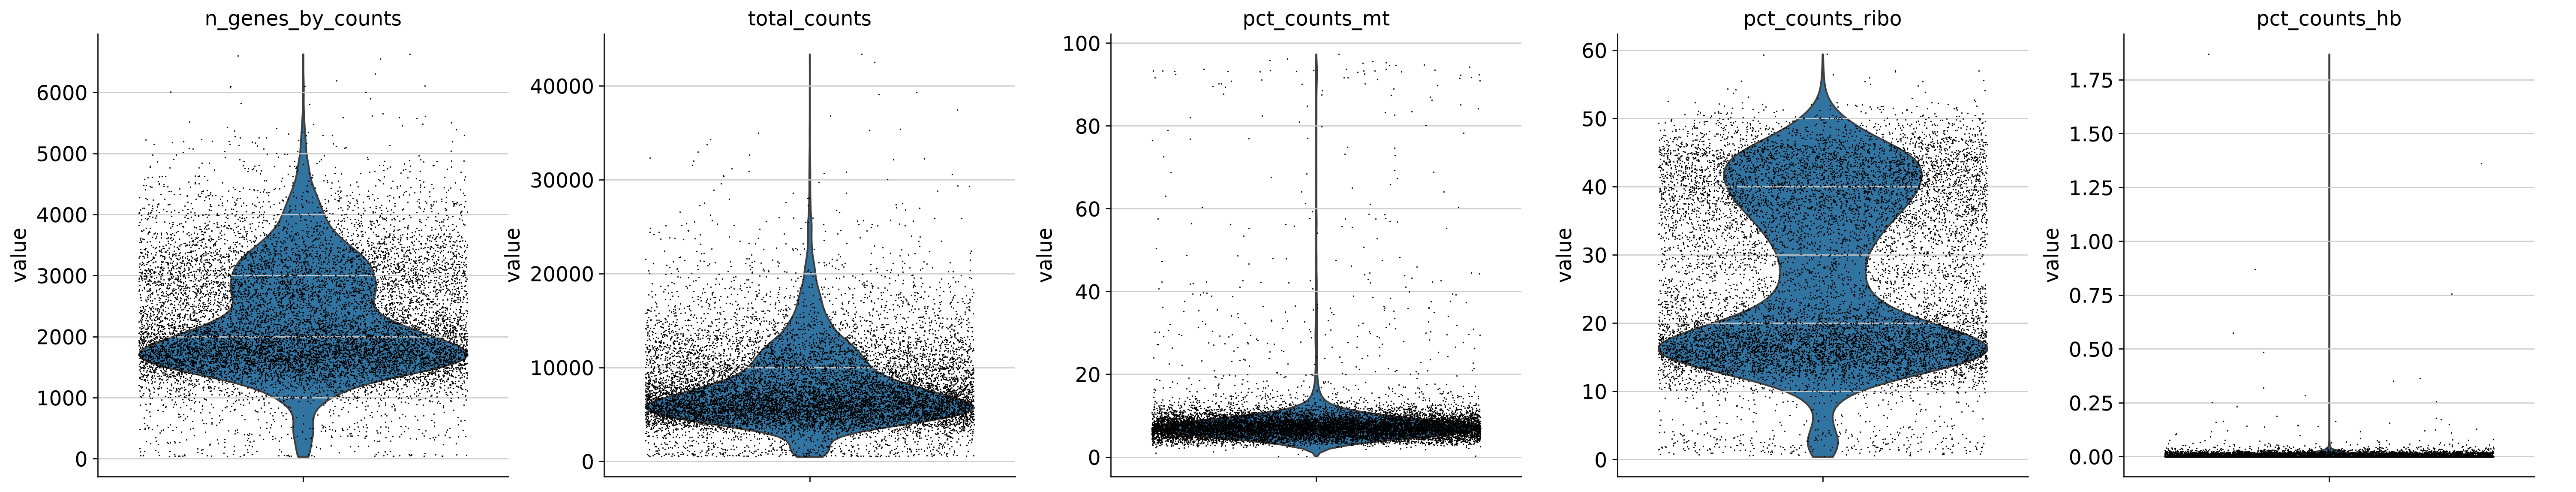
[5]:
sc.pl.violin(
    adata,
    ["n_genes_by_counts", "total_counts", "pct_counts_mt", 'pct_counts_ribo', 'pct_counts_hb'],
    jitter=0.4,
    multi_panel=True,
)
[6]:
sc.pp.filter_cells(adata, min_genes=200)
sc.pp.filter_genes(adata, min_cells=3)
[7]:
# Detect doublets
sc.pp.scrublet(adata)
[8]:
# Remove doublets + other QC metrics
adata = adata[adata.obs['predicted_doublet'] == False]
sc.pp.filter_cells(adata, max_genes = 5000)
sc.pp.filter_cells(adata, max_counts = 20000)
adata = adata[adata.obs['pct_counts_mt'] < 15]
Normalization, HVG, neighbors, PCA, UMAP#
We recommend using shifted logarithm data normalization as described here.
[9]:
# Saving count data
adata.layers["counts"] = adata.X.copy()
# Normalization (shifted logarithm)
sc.pp.normalize_total(adata, target_sum=None)
sc.pp.log1p(adata)
# scParadise use normalized data in adata.raw!!!
adata.raw = adata
# HVG
sc.pp.highly_variable_genes(adata, n_top_genes=2000)
# PCA
sc.tl.pca(adata)
# Nearest neighbors analysis
sc.pp.neighbors(adata, n_neighbors=10, n_pcs=30)
# UMAP
sc.tl.umap(adata, min_dist=0.75)
scParadise prediction (scAdam)#
You can view all available scAdam models by calling scparadise.scadam.available_models without arguments, or by visiting the Models page in the scParadise documentation.
[10]:
# Available models for cell type annotation
scparadise.scadam.available_models(
    species = 'human',
    tissue = 'blood'
)
[10]:
| Model name | Tissue/Organ | Species | Description | Suspension | Accuracy | Balanced Accuracy | Number of Levels | |
|---|---|---|---|---|---|---|---|---|
| 0 | Human_PBMC | blood | human | Peripheral blood mononuclear cells of healthy ... | cells | 0.979 | 0.979 | 3 |
[11]:
# Download model for cell type prediction
scparadise.scadam.download_model('Human_PBMC', save_path='')
[12]:
# Predict cell types using trained model
adata = scparadise.scadam.predict(
    adata,
    path_model = 'Human_PBMC' # or 'Human_PBMC_scAdam'
)
Cell type annotation using the 2nd version of the scAdam model
scAdam model with unknown detector loaded from Human_PBMC_scAdam
Gene alignment:
  Model features: 947
  Matched features: 935 (98.7%)
Predicting: 100%|██████████████████████████████| 43/43 [00:00<00:00, 59.96it/s]
Added cell type column: pred_celltype_l1
Added probabilities column: pred_celltype_l1_probability
Added cell type column: pred_celltype_l2
Added probabilities column: pred_celltype_l2_probability
Added cell type column: pred_celltype_l3
Added probabilities column: pred_celltype_l3_probability
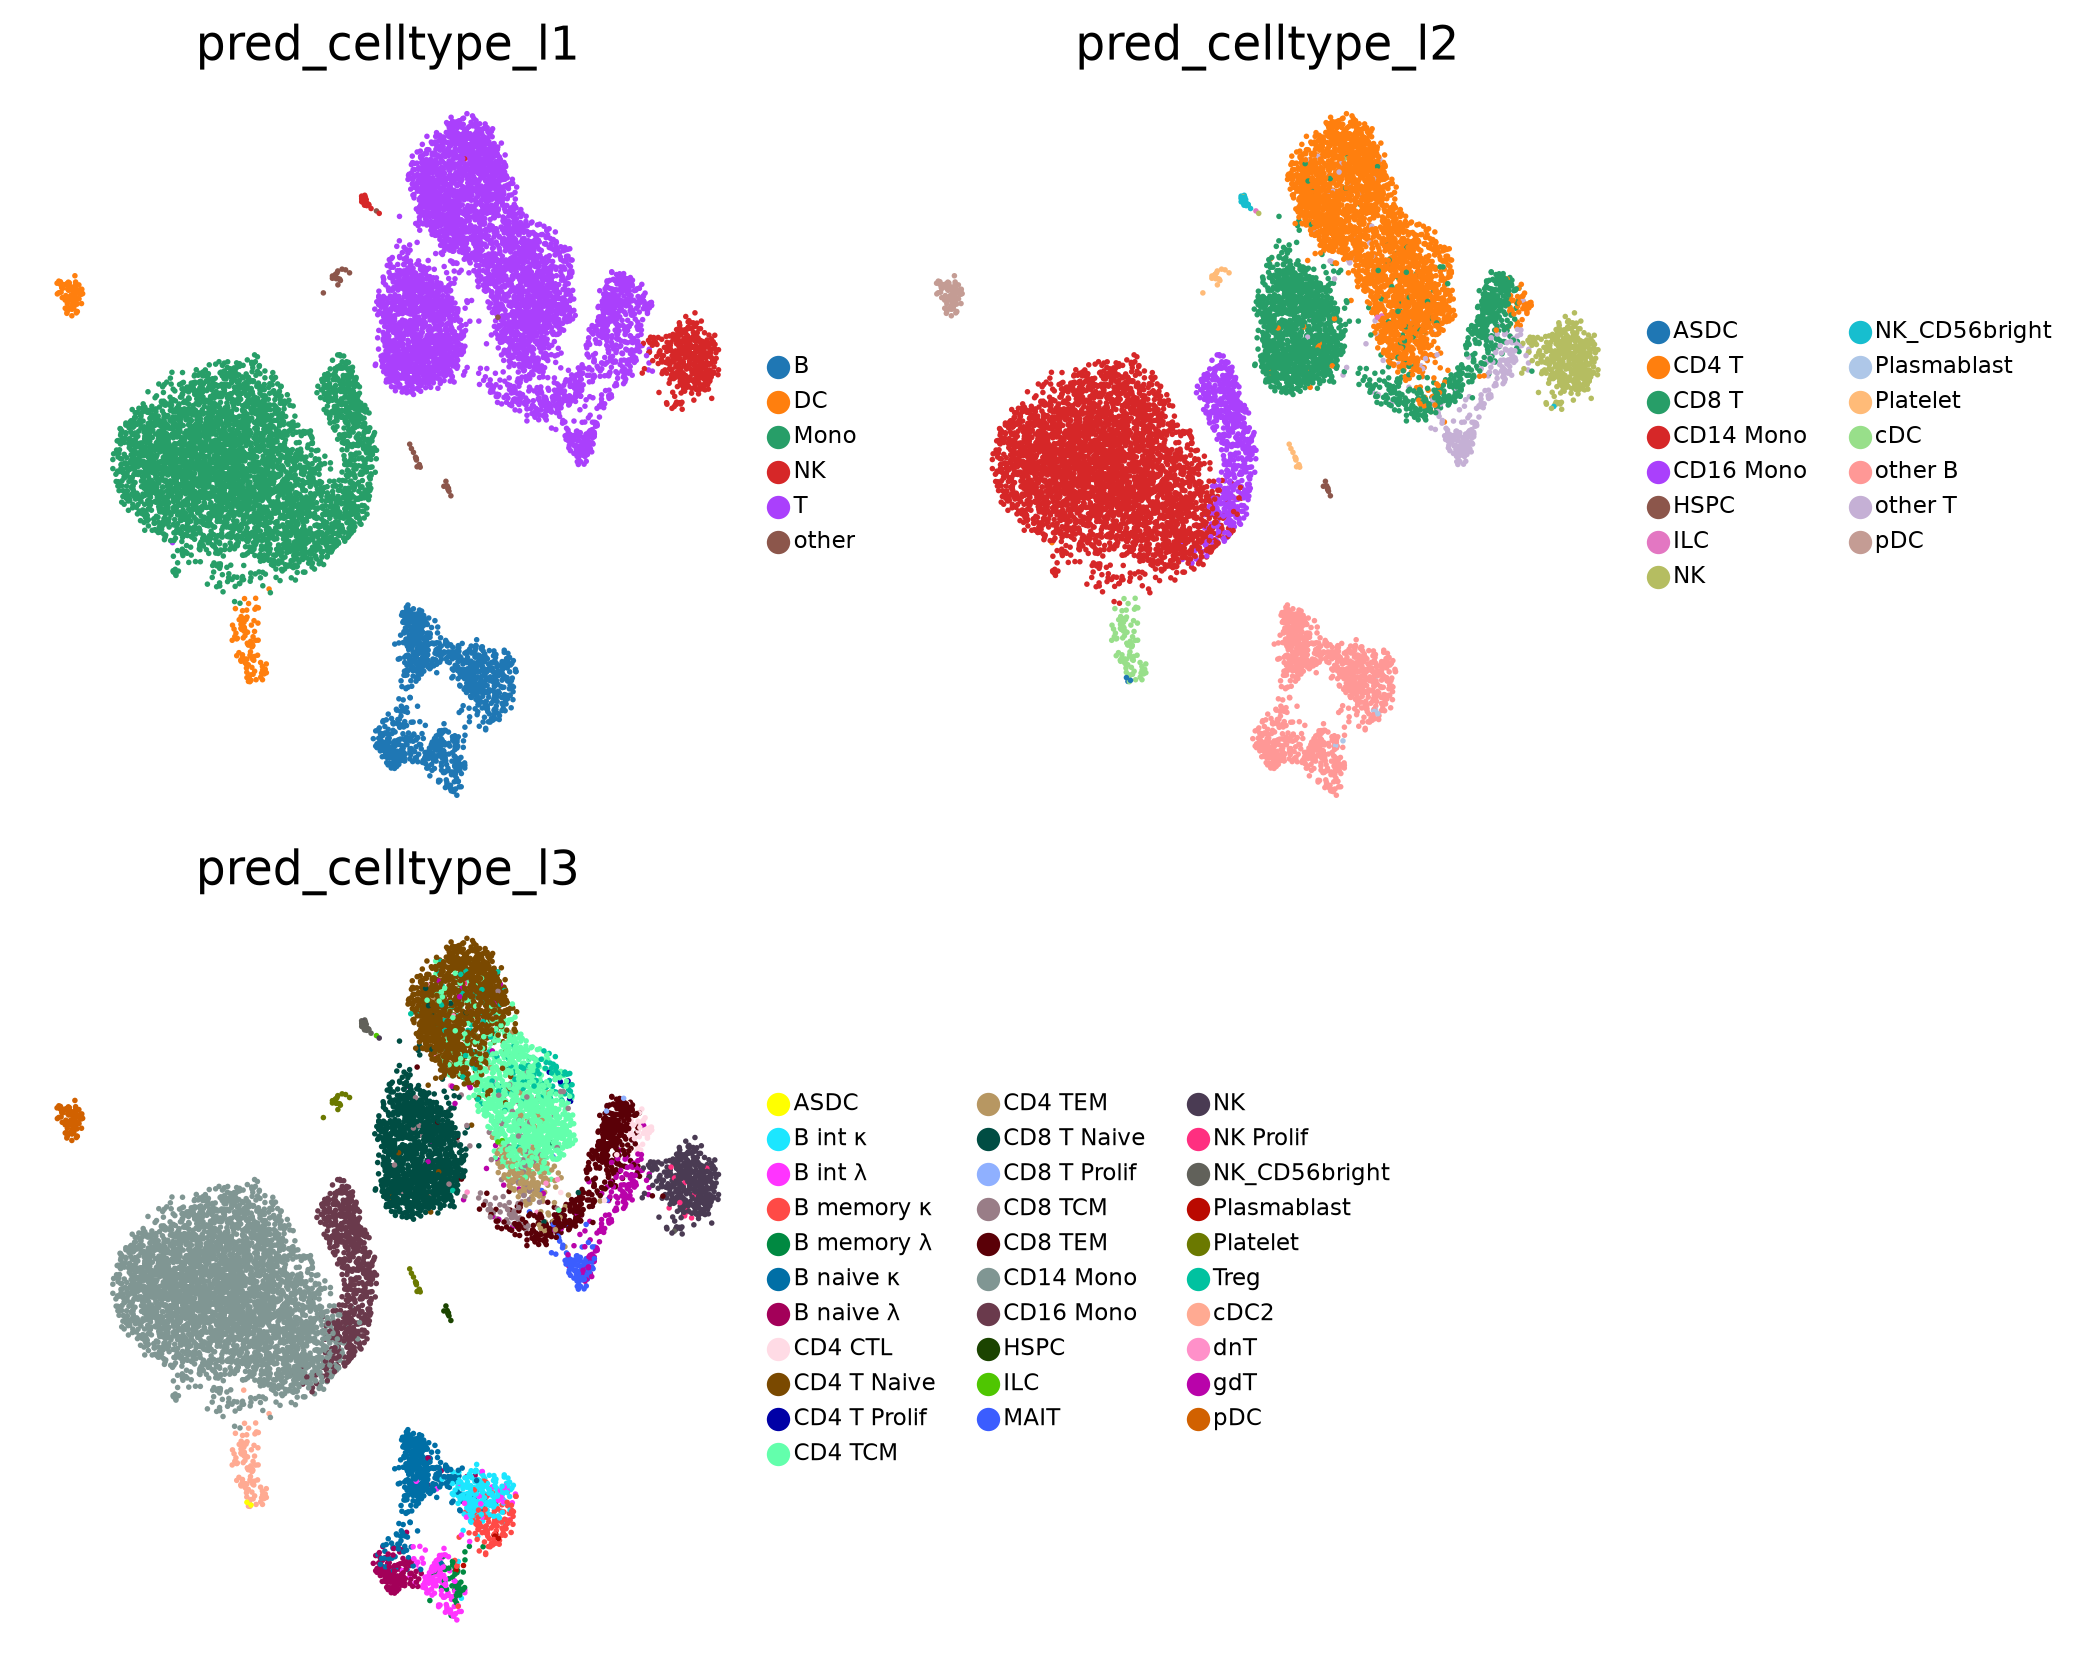
[13]:
# Visualise predicted cell types levels
sc.pl.embedding(
    adata,
    color = [
        'pred_celltype_l1',
        'pred_celltype_l2',
        'pred_celltype_l3',
    ],
    basis = 'X_umap',
    frameon = False,
    legend_loc = 'right margin',
    legend_fontsize = 7,
    ncols = 2,
    wspace = 0.1,
    hspace = 0.1
)
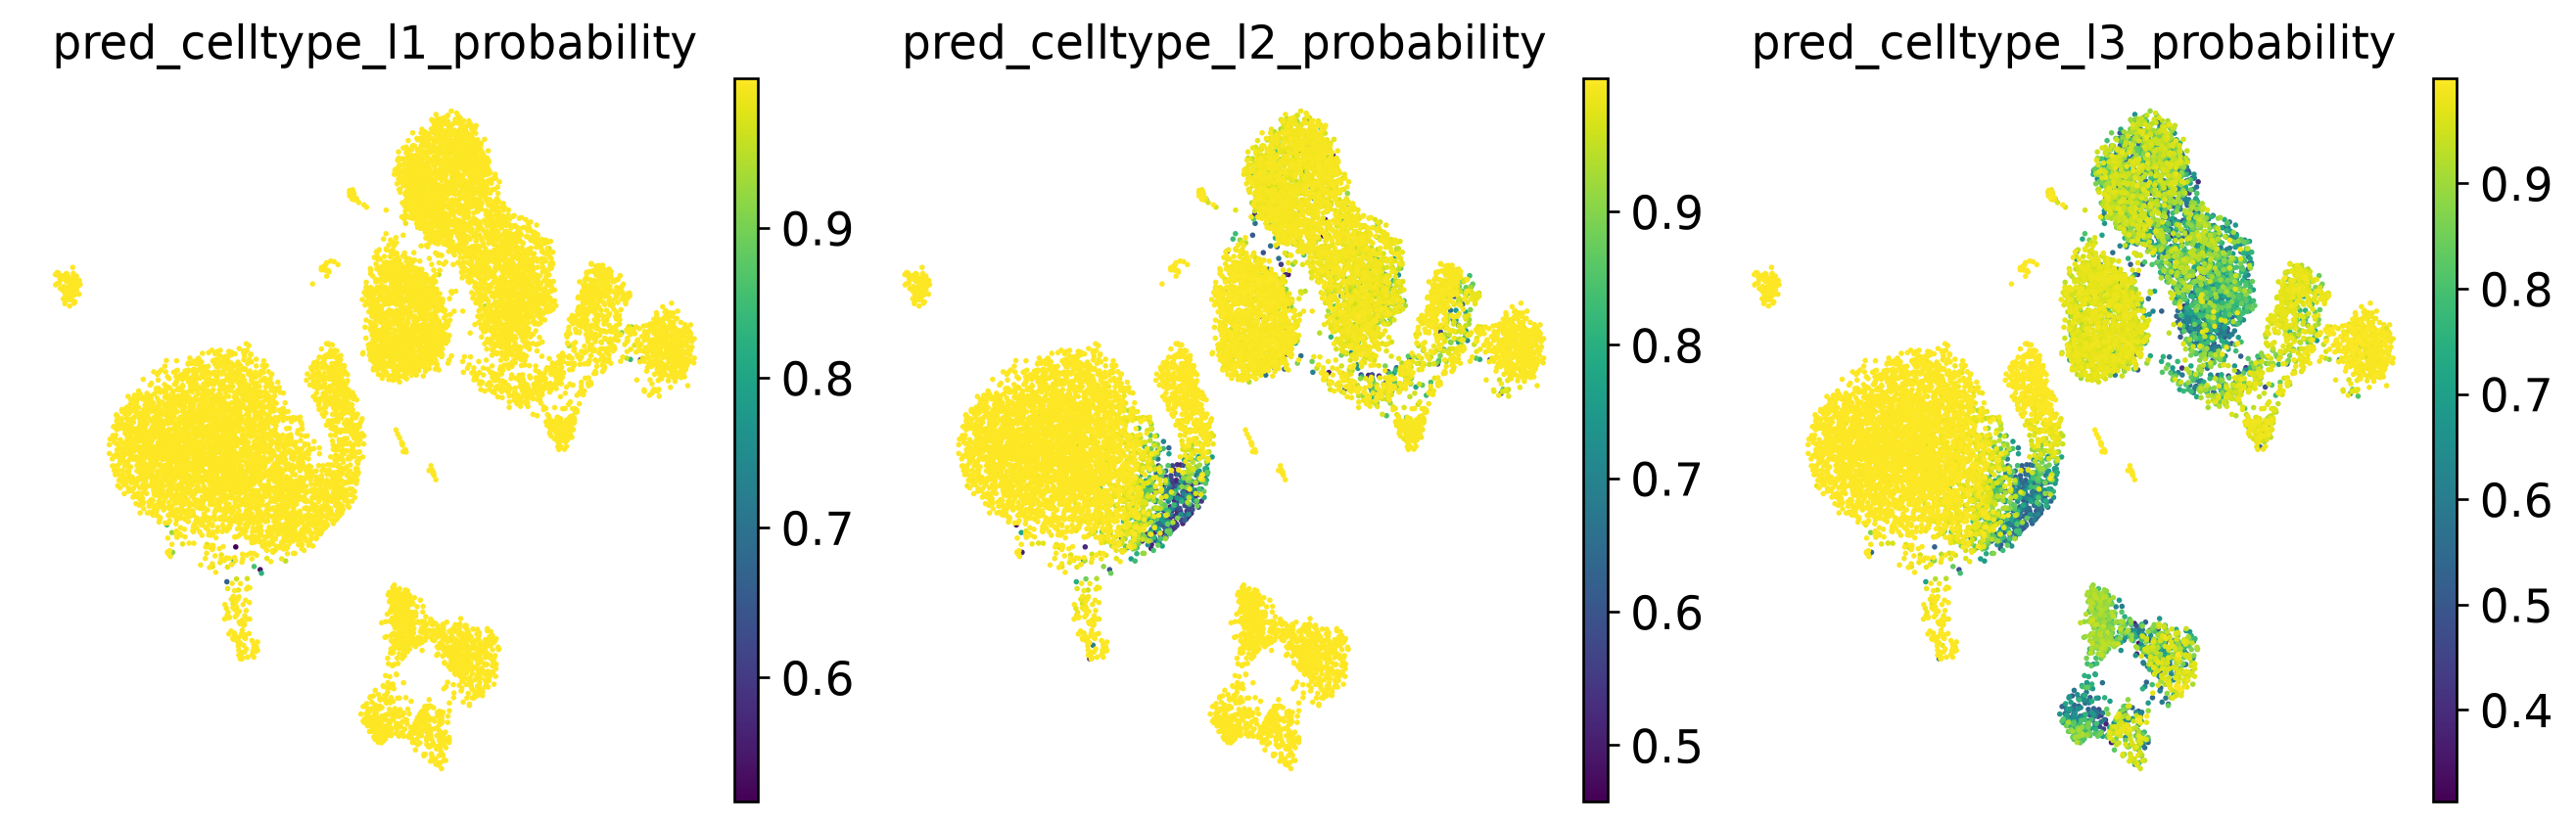
[14]:
# Visualise prediction probabilities
sc.pl.embedding(
    adata,
    color = [
        'pred_celltype_l1_probability',
        'pred_celltype_l2_probability',
        'pred_celltype_l3_probability',
    ],
    basis = 'X_umap',
    frameon = False,
    legend_loc = 'right margin',
    legend_fontsize = 7,
    ncols = 3,
    wspace = 0.1,
    hspace = 0.1
)
Check prediction results#
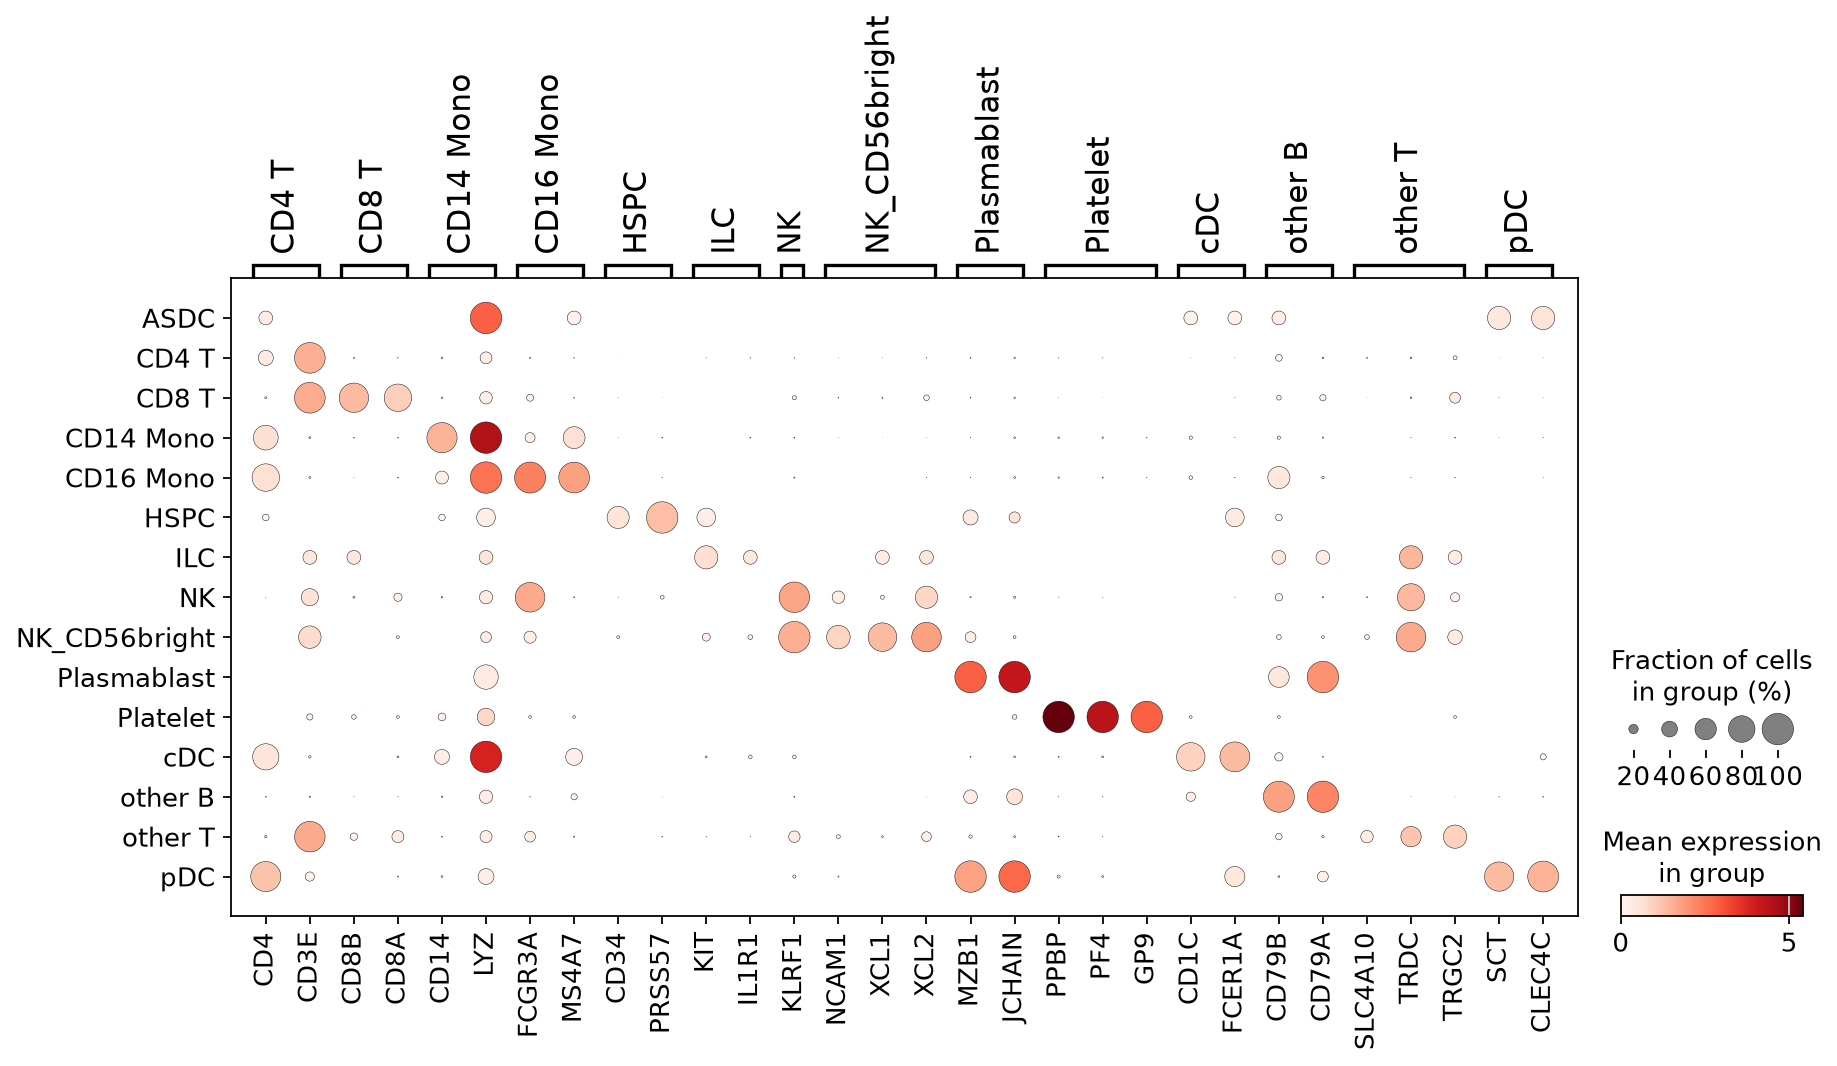
[15]:
# Visualization of marker genes of some predicted cell types
marker_genes = {
    "CD4 T" : ['CD4', 'CD3E'],
    "CD8 T" : ['CD8B', 'CD8A'],
    "CD14 Mono": ['CD14', 'LYZ'],
    "CD16 Mono": ['FCGR3A', 'MS4A7'],
    "HSPC": ['CD34', 'PRSS57'],
    "ILC": ['KIT', 'IL1R1'],
    "NK": ['KLRF1'],
    "NK_CD56bright": ['NCAM1', 'XCL1', 'XCL2'],
    "Plasmablast": ['MZB1', 'JCHAIN'],
    "Platelet": ['PPBP', 'PF4', 'GP9'],
    "cDC": ['CD1C', 'FCER1A'],
    "other B": ['CD79B', 'CD79A'],
    "other T": ['SLC4A10', "TRDC", 'TRGC2'],
    "pDC": ['SCT', 'CLEC4C'],
}
[16]:
# Dot plot
sc.set_figure_params(dpi = 80)
sc.pl.dotplot(adata, marker_genes, "pred_celltype_l2", dendrogram=False)
[17]:
# Make Axes
# Number of needed rows and columns (based on the row with the most columns)
nrow = len(marker_genes)
ncol = max([len(vs) for vs in marker_genes.values()])
fig, axs = plt.subplots(nrow, ncol, figsize=(4 * ncol, 4 * nrow))
# Plot expression for every marker on the corresponding Axes object
for row_idx, (cell_type, markers) in enumerate(marker_genes.items()):
    col_idx = 0
    for marker in markers:
        ax = axs[row_idx, col_idx]
        sc.pl.umap(
            adata,
            color=marker,
            ax=ax,
            show=False,
            cmap='bwr',
            frameon=False,
        )
        # Add cell type as row label - here we simply add it as ylabel of
        # the first Axes object in the row
        if col_idx == 0:
            # We disabled axis drawing in UMAP to have plots without background and border
            # so we need to re-enable axis to plot the ylabel
            ax.axis("on")
            ax.tick_params(
                top="off",
                bottom="off",
                left="off",
                right="off",
                labelleft="on",
                labelbottom="off",
            )
            ax.set_ylabel(cell_type + "\n", rotation=90, fontsize=14)
            ax.set(frame_on=False)
        col_idx += 1
    # Remove unused column Axes in the current row
    while col_idx < ncol:
        axs[row_idx, col_idx].remove()
        col_idx += 1
# Alignment within the Figure
fig.tight_layout()
[18]:
# Save anndata with predicted annotations
adata.write_h5ad('PBMC_annotated.h5ad')
Pancreas#
Below is an example of cross-technology scAdam cell type annotation. Here, we use an scAdam model trained on a dataset generated with 10x Genomics technology to annotate cell types in five other scRNA-seq technologies: CEL-Seq, Fluidigm C1, Smart-seq2, Smarter, and inDrop.
Download the pancreas benchmarking dataset from the scIB benchmarks. The prepared integrated dataset is available on Figshare: https://figshare.com/ndownloader/files/65860794
[19]:
# Extract data
import gzip, shutil
with gzip.open("pancreas.h5ad.gz", "rb") as f_in:
    with open("pancreas.h5ad", "wb") as f_out:
        shutil.copyfileobj(f_in, f_out)
[20]:
adata = sc.read("pancreas.h5ad")
adata
[20]:
AnnData object with n_obs × n_vars = 16375 × 19093
    obs: 'tech', 'celltype', 'corrected_celltype'
    obsm: 'X_umap'
Normalization, HVG, neighbors, PCA, UMAP#
We recommend using shifted logarithm data normalization as described here.
[21]:
# Saving count data
adata.layers["counts"] = adata.X.copy()
# Normalization (shifted logarithm)
sc.pp.normalize_total(adata, target_sum=None)
sc.pp.log1p(adata)
# scParadise use normalized data in adata.raw!!!
adata.raw = adata
scParadise prediction (scAdam)#
You can view all available scAdam models by calling scparadise.scadam.available_models without arguments, or by visiting the Models page in the scParadise documentation.
[22]:
# Available models for cell type annotation
scparadise.scadam.available_models(
    species = 'human',
    tissue = 'pancreas'
)
[22]:
| Model name | Tissue/Organ | Species | Description | Suspension | Accuracy | Balanced Accuracy | Number of Levels | |
|---|---|---|---|---|---|---|---|---|
| 0 | Human_Pancreas | pancreas | human | Pancreatic islet atlas | cells | 0.996 | 0.989 | 1 |
[23]:
# Predict cell types using trained model
adata = scparadise.scadam.predict(
    adata,
    path_model = 'Human_Pancreas' # or 'Human_Pancreas_scAdam'
)
Cell type annotation using the 2nd version of the scAdam model
scAdam model with unknown detector loaded from Human_Pancreas_scAdam
Gene alignment:
  Model features: 624
  Matched features: 589 (94.4%)
Predicting: 100%|█████████████████████████████| 64/64 [00:00<00:00, 154.85it/s]
Added cell type column: pred_celltype_l1
Added probabilities column: pred_celltype_l1_probability
[24]:
# Visualise predicted cell types levels
sc.pl.embedding(
    adata,
    color = [
        'pred_celltype_l1',
        'pred_celltype_l1_probability'
    ],
    basis = 'X_umap',
    frameon = False,
    wspace = 0.4,
    legend_loc = 'right margin'
)
[25]:
# Visualization of marker genes of some predicted cell types
marker_genes = {
    "Alpha" : ['GCG', 'DPP4', 'TTR'],
    "Beta" : ['INS', 'IAPP', 'MAFA'],
    "Acinar": ['PRSS1', 'CPA1', 'CPA2'],
    "Delta": ['SST', 'LY6H'],
    "Ductal": ['KRT19', 'SPP1', 'CFTR'],
    "Endothelial": ['PECAM1', 'KDR', 'CDH5', 'CLDN5'],
    "Epsilon": ['GHRL'],
    "Leukocyte": ['PTPRC', 'CD14', 'CD68'],
    "Mast": ['TPSAB1', 'CPA3'],
    "PP": ['PPY'],
    "Schwann": ['NGFR', 'S100B'],
    "Stellate": ['COL1A1', 'COL1A2', 'THY1']
}
[26]:
# Make Axes
# Number of needed rows and columns (based on the row with the most columns)
nrow = len(marker_genes)
ncol = max([len(vs) for vs in marker_genes.values()])
fig, axs = plt.subplots(nrow, ncol, figsize=(4 * ncol, 4 * nrow))
# Plot expression for every marker on the corresponding Axes object
for row_idx, (cell_type, markers) in enumerate(marker_genes.items()):
    col_idx = 0
    for marker in markers:
        ax = axs[row_idx, col_idx]
        sc.pl.umap(
            adata,
            color=marker,
            ax=ax,
            show=False,
            cmap='bwr',
            vmax='p99',
            frameon=False
        )
        # Add cell type as row label - here we simply add it as ylabel of
        # the first Axes object in the row
        if col_idx == 0:
            # We disabled axis drawing in UMAP to have plots without background and border
            # so we need to re-enable axis to plot the ylabel
            ax.axis("on")
            ax.tick_params(
                top="off",
                bottom="off",
                left="off",
                right="off",
                labelleft="on",
                labelbottom="off",
            )
            ax.set_ylabel(cell_type + "\n", rotation=90, fontsize=14)
            ax.set(frame_on=False)
        col_idx += 1
    # Remove unused column Axes in the current row
    while col_idx < ncol:
        axs[row_idx, col_idx].remove()
        col_idx += 1
# Alignment within the Figure
fig.tight_layout()
[27]:
adata.write_h5ad('pancreas_annotated.h5ad')
[28]:
import session_info
session_info.show()
[28]:
Click to view session information
-----
anndata             0.12.16
matplotlib          3.11.0
numpy               2.4.6
pandas              2.3.3
scanpy              1.11.5
scparadise          1.1.0
session_info        v1.0.1
-----
Click to view modules imported as dependencies
81d243bd2c585b0f4821__mypyc NA
PIL                         12.2.0
aiohappyeyeballs            2.6.2
aiohttp                     3.14.1
aiosignal                   1.4.0
anyio                       NA
arrow                       1.4.0
asttokens                   NA
attr                        26.1.0
attrs                       26.1.0
babel                       2.18.0
certifi                     2026.05.20
cffi                        2.0.0
charset_normalizer          3.4.7
cloudpickle                 3.1.2
colorlog                    NA
comm                        0.2.3
cuda                        NA
cycler                      0.12.1
cython_runtime              NA
dateutil                    2.9.0.post0
debugpy                     1.8.21
decorator                   5.3.1
defusedxml                  0.7.1
donfig                      0.8.1.post1
executing                   2.2.1
fastjsonschema              NA
fontTools                   4.63.0
fqdn                        NA
frozenlist                  1.8.0
fsspec                      2026.4.0
google_crc32c               NA
gseapy                      1.2.1
h5py                        3.16.0
idna                        3.18
igraph                      1.0.0
imblearn                    0.14.2
ipykernel                   7.3.0
isoduration                 NA
jedi                        0.20.0
jinja2                      3.1.6
joblib                      1.5.3
json5                       0.14.0
jsonpointer                 3.1.1
jsonschema                  4.26.0
jsonschema_specifications   NA
jupyter_events              0.12.1
jupyter_server              2.20.0
jupyterlab_server           2.28.0
kiwisolver                  1.5.0
lark                        1.3.1
lazy_loader                 0.5
legacy_api_wrap             NA
leidenalg                   0.12.0
llvmlite                    0.47.0
markupsafe                  3.0.3
matplotlib_inline           0.2.2
matplotlib_venn             1.1.2
mpl_toolkits                NA
mudata                      0.3.8
multidict                   6.7.1
muon                        0.1.7
narwhals                    2.22.1
natsort                     8.4.0
nbformat                    5.10.4
networkx                    3.6.1
numba                       0.65.1
numcodecs                   0.16.5
opt_einsum                  3.4.0
optuna                      4.9.0
overrides                   NA
packaging                   26.0
parso                       0.8.7
patsy                       1.0.2
platformdirs                4.10.0
plottable                   0.1.5
prometheus_client           NA
prompt_toolkit              3.0.52
propcache                   0.5.2
psutil                      7.2.2
pure_eval                   0.2.3
pyarrow                     24.0.0
pycparser                   3.00
pydev_ipython               NA
pydevconsole                NA
pydevd                      3.4.1
pydevd_file_utils           NA
pydevd_plugins              NA
pydevd_tracing              NA
pygments                    2.20.0
pynndescent                 0.6.0
pyparsing                   3.3.2
pythonjsonlogger            NA
pytorch_tabnet              NA
pytz                        2026.2
referencing                 NA
requests                    2.34.2
rfc3339_validator           0.1.4
rfc3986_validator           0.1.1
rfc3987_syntax              NA
rich                        NA
rpds                        NA
scipy                       1.17.1
scverse_misc                0.0.3
seaborn                     0.13.2
send2trash                  NA
shap                        0.51.0
six                         1.17.0
skimage                     0.26.0
sklearn                     1.9.0
sklearn_compat              0.1.6
slicer                      NA
sparse                      0.18.0
stack_data                  0.6.3
statsmodels                 0.14.6
testing                     NA
texttable                   1.7.0
threadpoolctl               3.6.0
torch                       2.12.0+cu130
torchgen                    NA
tornado                     6.5.7
tqdm                        4.68.2
traitlets                   5.15.1
typing_extensions           NA
umap                        0.5.12
uri_template                NA
urllib3                     2.7.0
wcwidth                     0.8.1
webcolors                   NA
websocket                   1.9.0
xarray                      2026.4.0
yaml                        6.0.3
yarl                        1.24.2
zarr                        3.1.6
zmq                         27.1.0
zoneinfo                    NA
-----
IPython             9.14.1
jupyter_client      8.9.1
jupyter_core        5.9.1
jupyterlab          4.6.0
-----
Python 3.11.15 (main, Jun 11 2026, 15:20:16) [GCC 14.3.0]
Linux-6.8.0-124-generic-x86_64-with-glibc2.39
-----
Session information updated at 2026-06-25 14:55