scAdam model explainability#
Model explainability refers to the ability to understand and articulate how a machine learning model makes its predictions or decisions.
scNoah uses SHAP (SHapley Additive exPlanations) for model explainability analysis.
SHAP values are derived from cooperative game theory, specifically using Shapley values, which quantify the contribution of each player (or feature/gene) to the total payoff (or prediction). This approach allows for a fair distribution of contributions among features, similar to how players in a coalition share the rewards based on their input.
The SHAP framework operates under the principle that the prediction for an instance can be expressed as the sum of the average prediction and the contributions of each feature. Mathematically, this can be represented as:
where \(prediction\) is the model’s prediction, \(f_0\) is the expected value of the output, \(f_i\) are the SHAP values for each feature.
SHAP provides a framework for both local explainability and global explainability in machine learning models.
Local Explainability: Focuses on explaining individual predictions (cells) made by the model. It seeks to clarify why a specific output was generated for a given input.
Global Explainability: Aims to provide an overall understanding of the model’s behavior across all predictions (cells), identifying the main factors that influence outputs.
[1]:
# Python packages
import warnings
warnings.simplefilter('ignore')

import scanpy as sc
import scparadise
import shap
import os
import matplotlib.pyplot as plt
import numpy as np
import pandas as pd

sc.set_figure_params(dpi = 120)
Recommendations about dataset#
Our models trained using shifted logarithm normalized data. We recommend shifted logarithm data normalization method to proper usage of our models: sc.pp.normalize_total(adata, target_sum=None) sc.pp.log1p(adata) adata.raw = adata
[2]:
# Load dataset from 10x Genomics
url = "https://cf.10xgenomics.com/samples/cell-exp/6.1.0/10k_PBMC_3p_nextgem_Chromium_X/10k_PBMC_3p_nextgem_Chromium_X_filtered_feature_bc_matrix.h5"
adata = sc.read_10x_h5("dataset.h5", backup_url = url)
adata.var_names_make_unique()
adata
[2]:
AnnData object with n_obs × n_vars = 11996 × 36601
    var: 'gene_ids', 'feature_types', 'genome'
QC#
[3]:
# mitochondrial genes, "MT-" for human, "Mt-" for mouse
adata.var["mt"] = adata.var_names.str.startswith("MT-")
# ribosomal genes
adata.var["ribo"] = adata.var_names.str.startswith(("RPS", "RPL"))
# hemoglobin genes
adata.var["hb"] = adata.var_names.str.contains("^HB[^(P)]")
[4]:
sc.pp.calculate_qc_metrics(
    adata, qc_vars=["mt", "ribo", "hb"], inplace=True, log1p=True
)
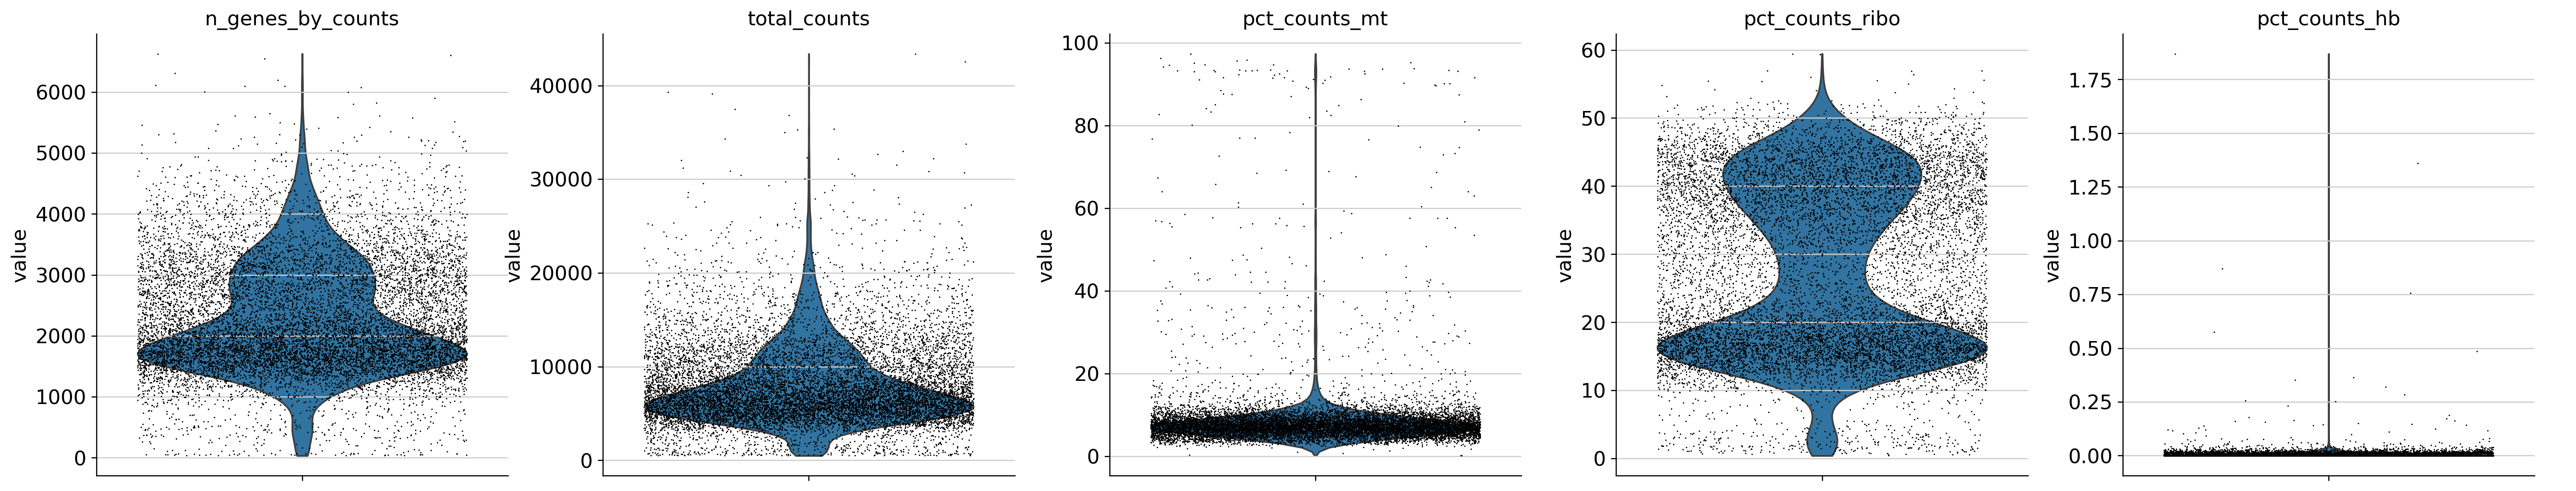
[5]:
sc.pl.violin(
    adata,
    ["n_genes_by_counts", "total_counts", "pct_counts_mt", 'pct_counts_ribo', 'pct_counts_hb'],
    jitter=0.4,
    multi_panel=True,
)
[6]:
sc.pp.filter_cells(adata, min_genes=200)
sc.pp.filter_genes(adata, min_cells=3)
[7]:
# Detect doublets
sc.pp.scrublet(adata)
[8]:
# Remove doublets + other QC metrics
adata = adata[adata.obs['predicted_doublet'] == False]
sc.pp.filter_cells(adata, max_genes = 5000)
sc.pp.filter_cells(adata, max_counts = 20000)
adata = adata[adata.obs['pct_counts_mt'] < 15]
Normalization, HVG, neighbors, PCA, UMAP#
We recommend using shifted logarithm data normalization as described here.
[9]:
# Saving count data
adata.layers["counts"] = adata.X.copy()
# Normalization (shifted logarithm)
sc.pp.normalize_total(adata, target_sum=None)
sc.pp.log1p(adata)
# scParadise use normalized data in adata.raw!!!
adata.raw = adata
# HVG
sc.pp.highly_variable_genes(adata, n_top_genes=2000)
# PCA
sc.tl.pca(adata)
# Nearest neighbors analysis
sc.pp.neighbors(adata, n_neighbors=10, n_pcs=20)
# UMAP
sc.tl.umap(adata)
Cell type prediction using scAdam#
[10]:
# Available models for cell type annotation
df = scparadise.scadam.available_models()
# Show models related to humans
df_human = df[df['Tissue/Model name'].str.startswith('Human_')]
df_human
[10]:
| Tissue/Model name | Description | Suspension | Accuracy | Balanced Accuracy | Number of Levels | |
|---|---|---|---|---|---|---|
| 0 | Human_PBMC | Peripheral blood mononuclear cells of healthy ... | cells | 0.979 | 0.979 | 3 |
| 1 | Human_BMMC | Bone marrow mononuclear cell of healthy adults | cells | 0.947 | 0.942 | 3 |
| 2 | Human_Heart | Human heart CITE-seq analysis of healthy and d... | cells | 0.957 | 0.956 | 2 |
| 3 | Human_Lung | Core Human Lung Cell Atlas | cells | 0.965 | 0.964 | 5 |
| 4 | Human_Lung_Cancer | Extended single-cell lung cancer atlas (LuCA) | cells | 0.937 | 0.936 | 3 |
| 5 | Human_oropharyngeal_SCC | Oropharyngeal HPV+/HPV- squamous cell carcinom... | cells | 0.972 | 0.968 | 2 |
| 6 | Human_Retina | Single cell atlas of the human retina | cells | 0.984 | 0.979 | 4 |
[11]:
# Download model for cell type prediction
scparadise.scadam.download_model('Human_PBMC', save_path='')
[12]:
# Predict cell types using trained model
adata = scparadise.scadam.predict(adata,
                                  path_model = 'Human_PBMC_scAdam/')
Successfully loaded list of genes used for training model

Successfully loaded dictionary of dataset annotations

Successfully loaded model

Successfully added predicted celltype_l1 and cell type probabilities
Successfully added predicted celltype_l2 and cell type probabilities
Successfully added predicted celltype_l3 and cell type probabilities
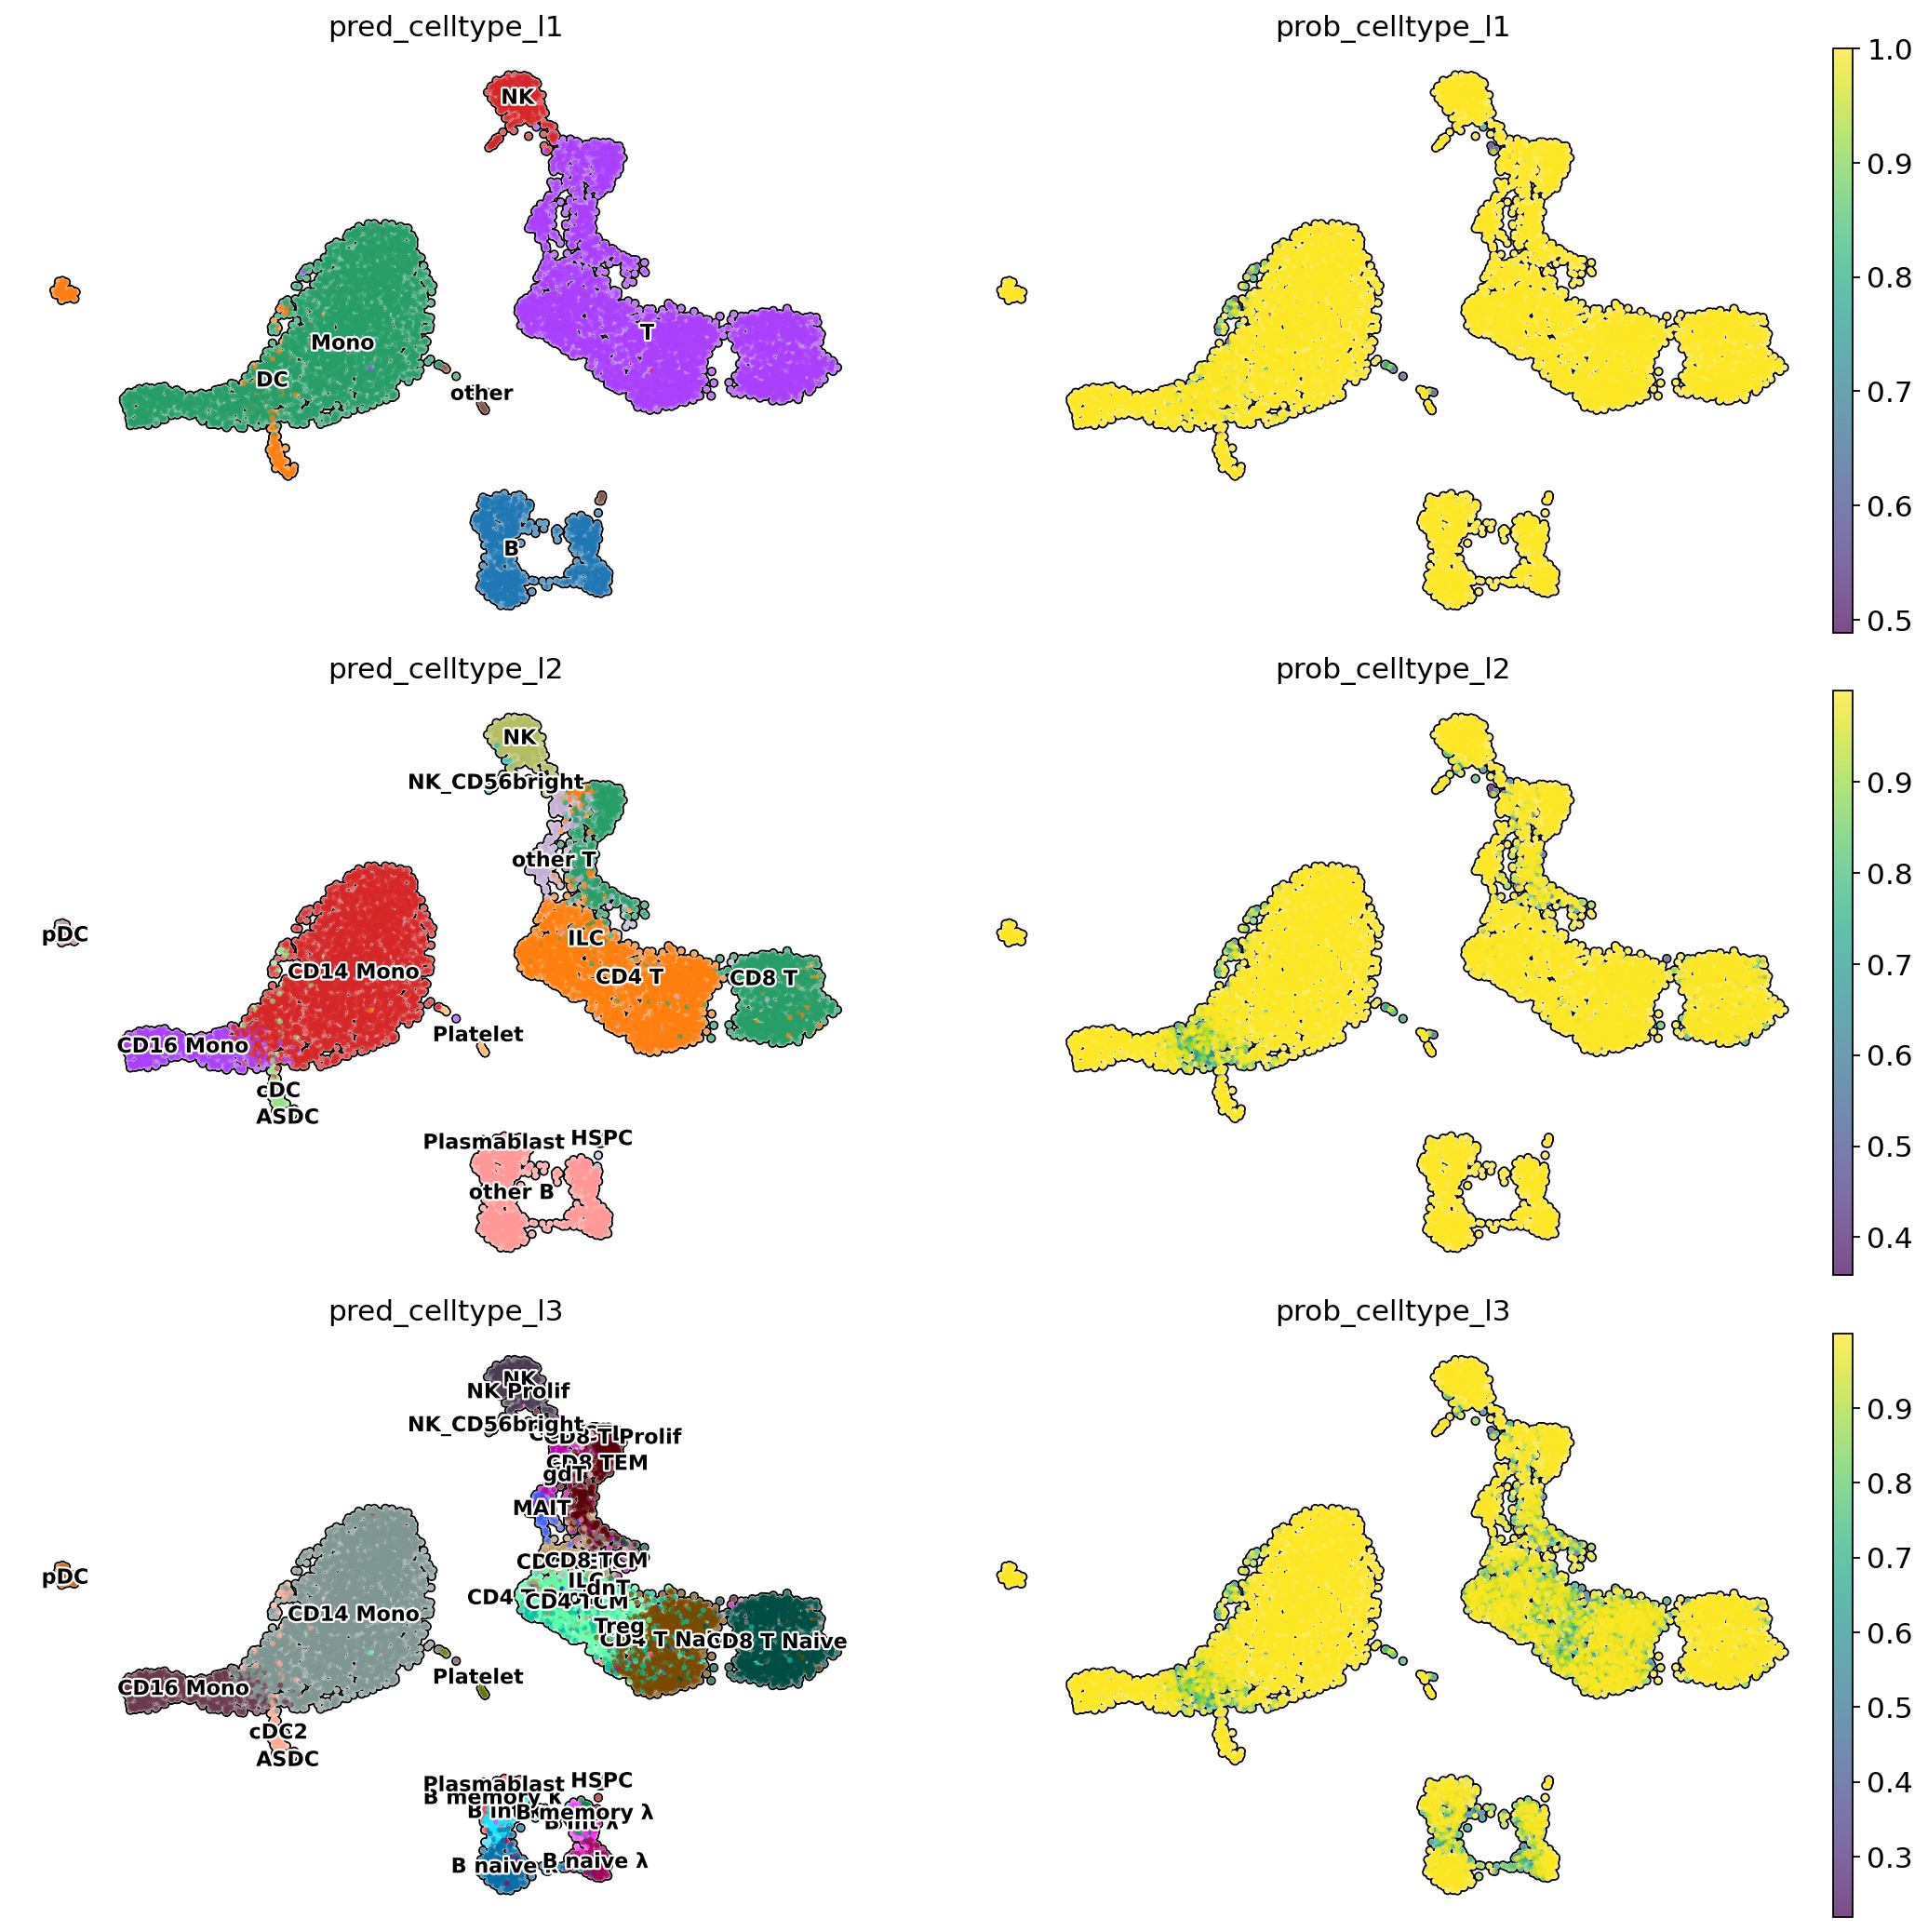
[13]:
# Visualise predicted cell types levels and prediction probabilities
sc.set_figure_params(figsize=[8, 5])
sc.pl.embedding(adata,
                color = [
                    'pred_celltype_l1',
                    'prob_celltype_l1',
                    'pred_celltype_l2',
                    'prob_celltype_l2',
                    'pred_celltype_l3',
                    'prob_celltype_l3'
                ],
                basis = 'X_umap',
                frameon = False,
                add_outline = True,
                legend_loc = 'on data',
                legend_fontsize = 10,
                legend_fontoutline = 2,
                ncols = 2,
                size = 30,
                wspace = 0,
                hspace = 0.1)
Create explanations matrix#
Compute SHAP values for a specific cell type predicted using scAdam model.
[14]:
# Compute explanations for CD8+ T cells
random_state = 0
num_cells = 100
explanations  = scparadise.scnoah.explain(adata,
                                          celltype = 'CD8 T',
                                          path_model = 'Human_PBMC_scAdam/',
                                          num_cells = num_cells,
                                          random_state = random_state)
Successfully loaded list of genes used for training model
Successfully loaded dictionary of dataset annotations
Successfully loaded model
Cell type "CD8 T" was successfully selected from pred_celltype_l2
PermutationExplainer explainer: 101it [02:40, 1.69s/it]
The explanations for "CD8 T" have been completed
[15]:
# General explainability
# Calculate gene impoortances
gene_importances = scparadise.scnoah.feature_importance(explanations,
                                                         path_model = 'Human_PBMC_scAdam/')
# Show 15 most important genes for CD8+ T cells annotation
gene_importances.head(15)
[15]:
| gene_name | gene_importance | |
|---|---|---|
| 76 | GZMK | 0.284200 |
| 593 | CCL5 | 0.221275 |
| 108 | GZMA | 0.082325 |
| 539 | CD8A | 0.078000 |
| 425 | IL7R | 0.051650 |
| 40 | CCR7 | 0.048450 |
| 72 | NKG7 | 0.041350 |
| 403 | CD8B | 0.040450 |
| 116 | TIGIT | 0.033150 |
| 220 | ITGB1 | 0.025675 |
| 386 | LYAR | 0.025250 |
| 506 | FCMR | 0.024350 |
| 305 | KLRD1 | 0.024000 |
| 17 | NUCB2 | 0.023825 |
| 604 | MAL | 0.023225 |
[16]:
# Visualization of gene importancies on cell embeddings
sc.pl.embedding(adata,
                color = gene_importances.head(16)['gene_name'],
                basis = 'X_umap',
                frameon = False,
                add_outline = True,
                size = 30,
                ncols=4)
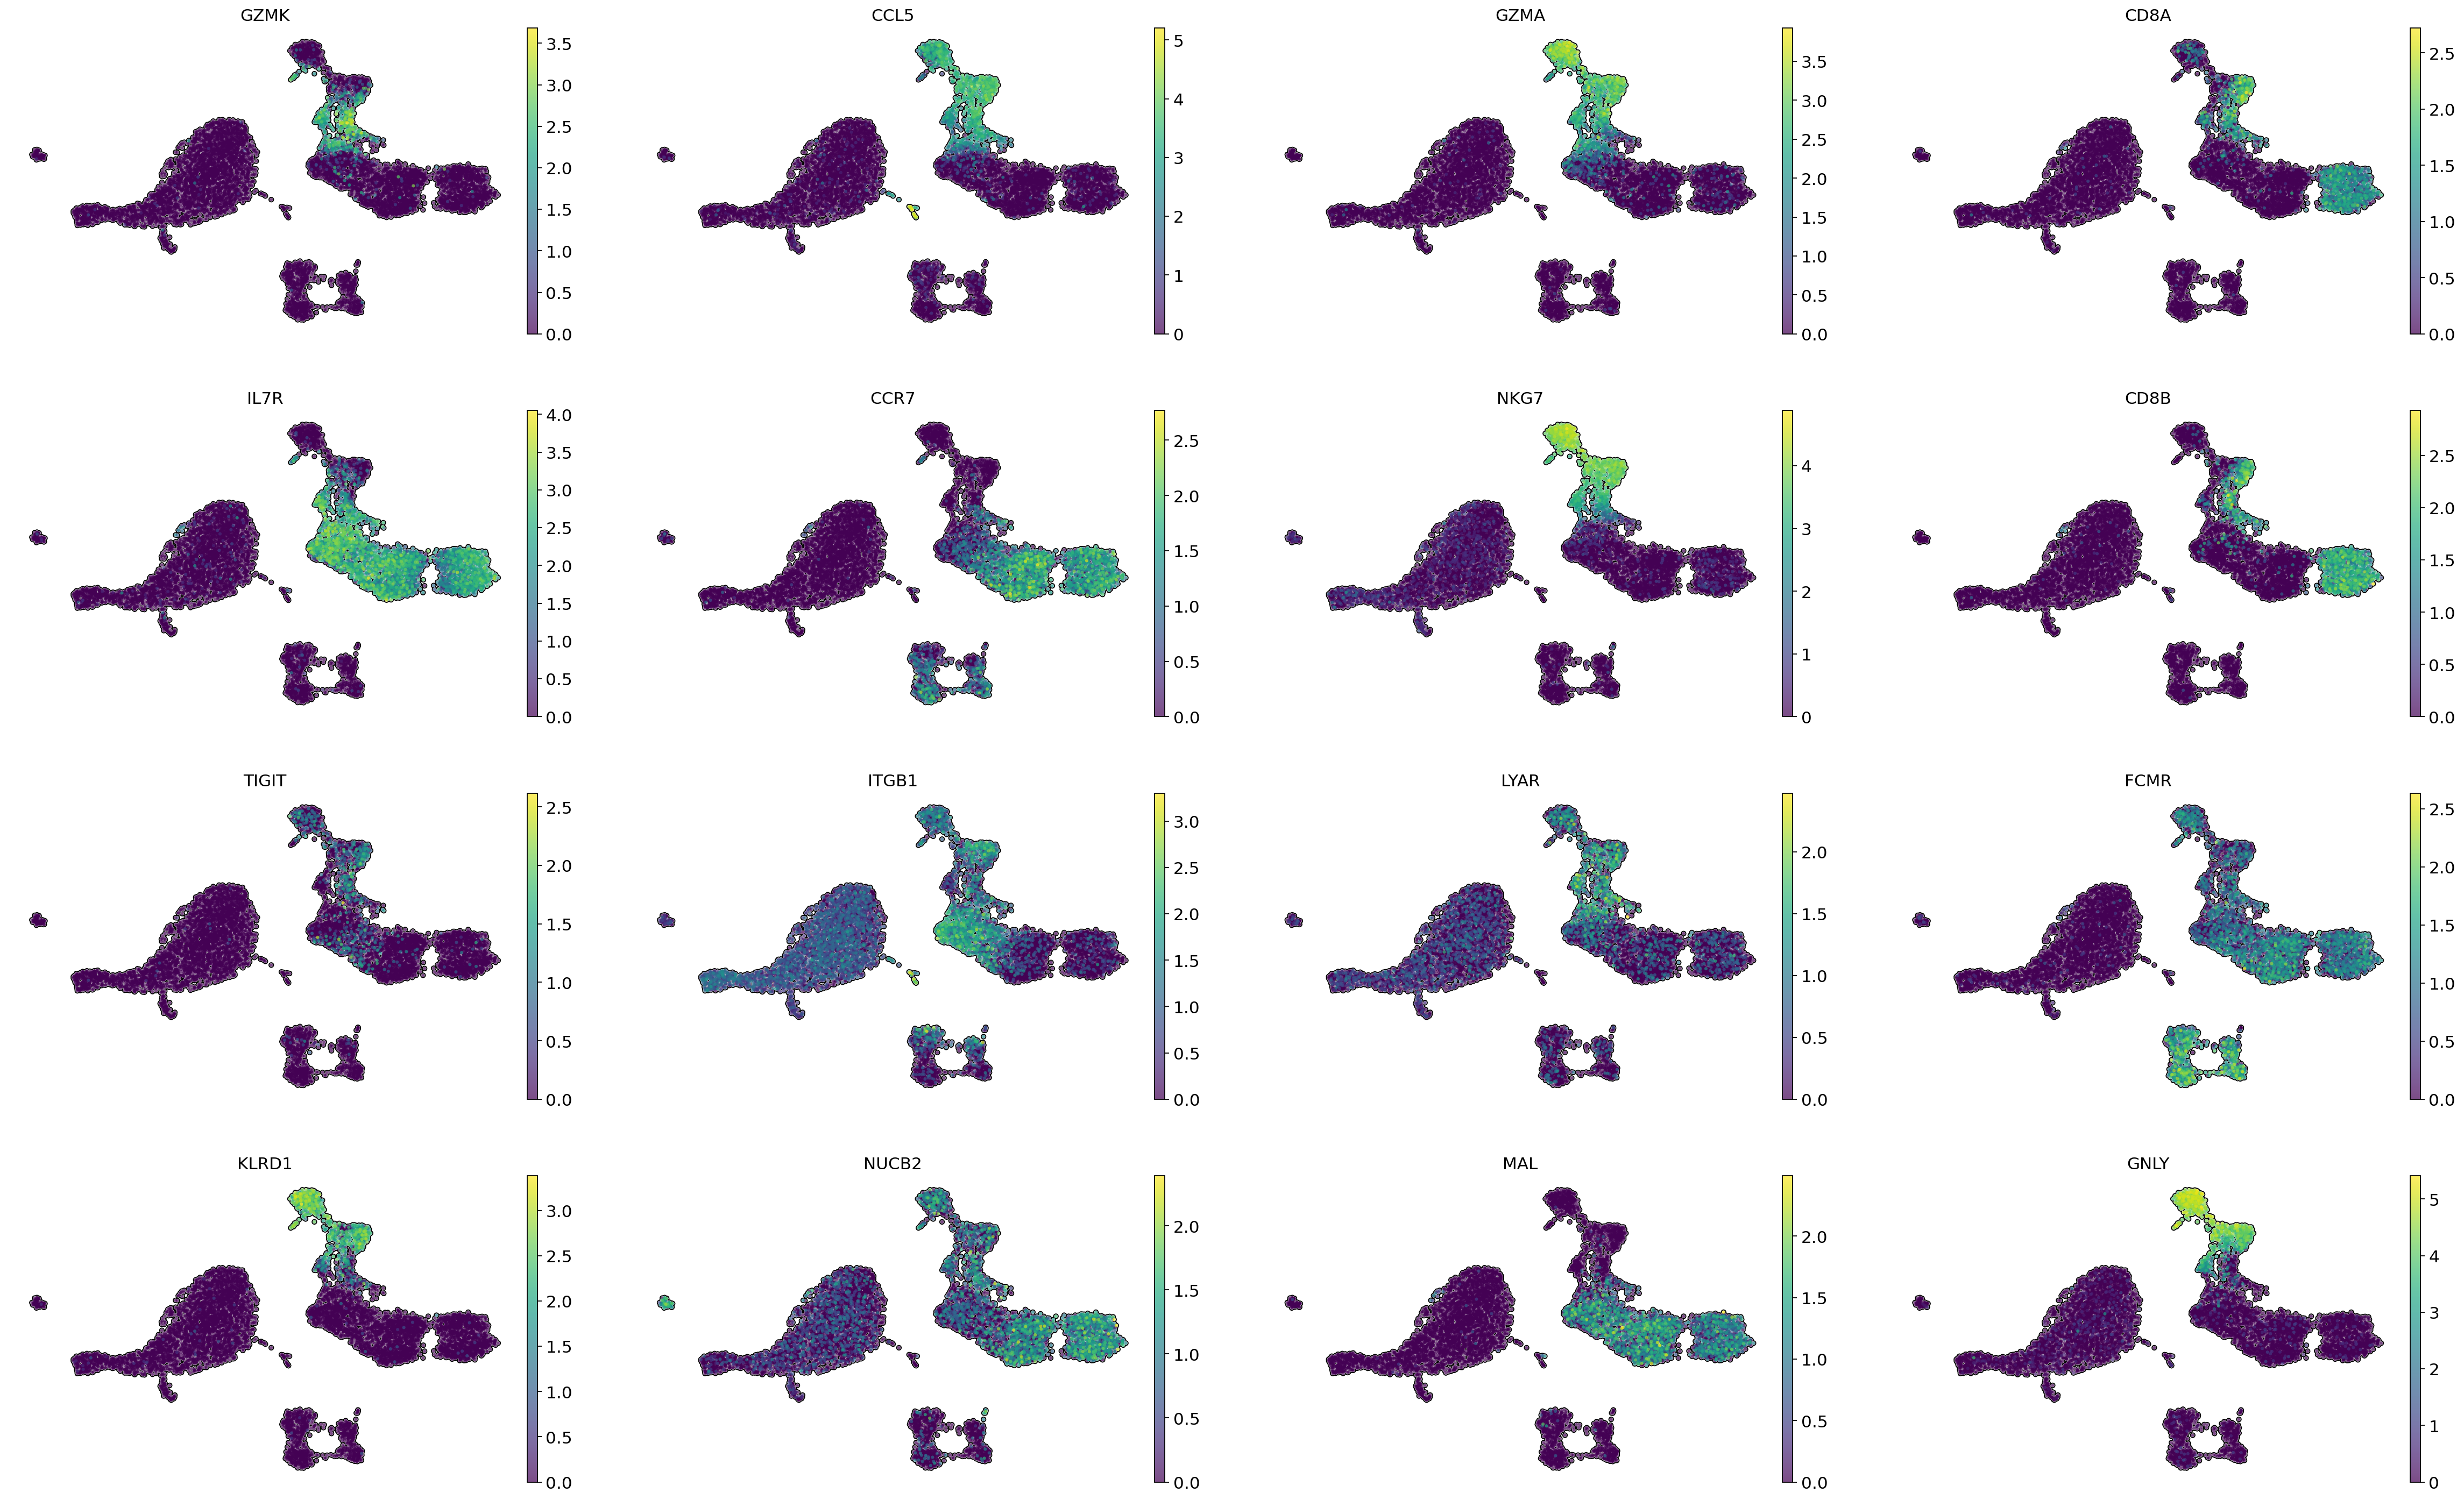
gene_importances indicate the significance of the genes CD8A and CD8B for the annotation of CD8+ T cells, which makes sense since these genes are markers of these cells. Additionally, among the genes with high gene importance values are markers for various subtypes of CD8+ T cells. GZMK, GZMA, CCL5, NKG7, and KLRD1 are markers of memory CD8+ T cells, while IL7R and CCR7 are markers of naive CD8+ T cells.
Analysis of explanations#
Positive SHAP value indicates that a particular feature (gene) has a significant impact on the model’s prediction for a specific instance (cell type).
Negative SHAP value indicates that a specific feature (gene) has a detrimental effect on the model’s prediction for a given instance (cell type).
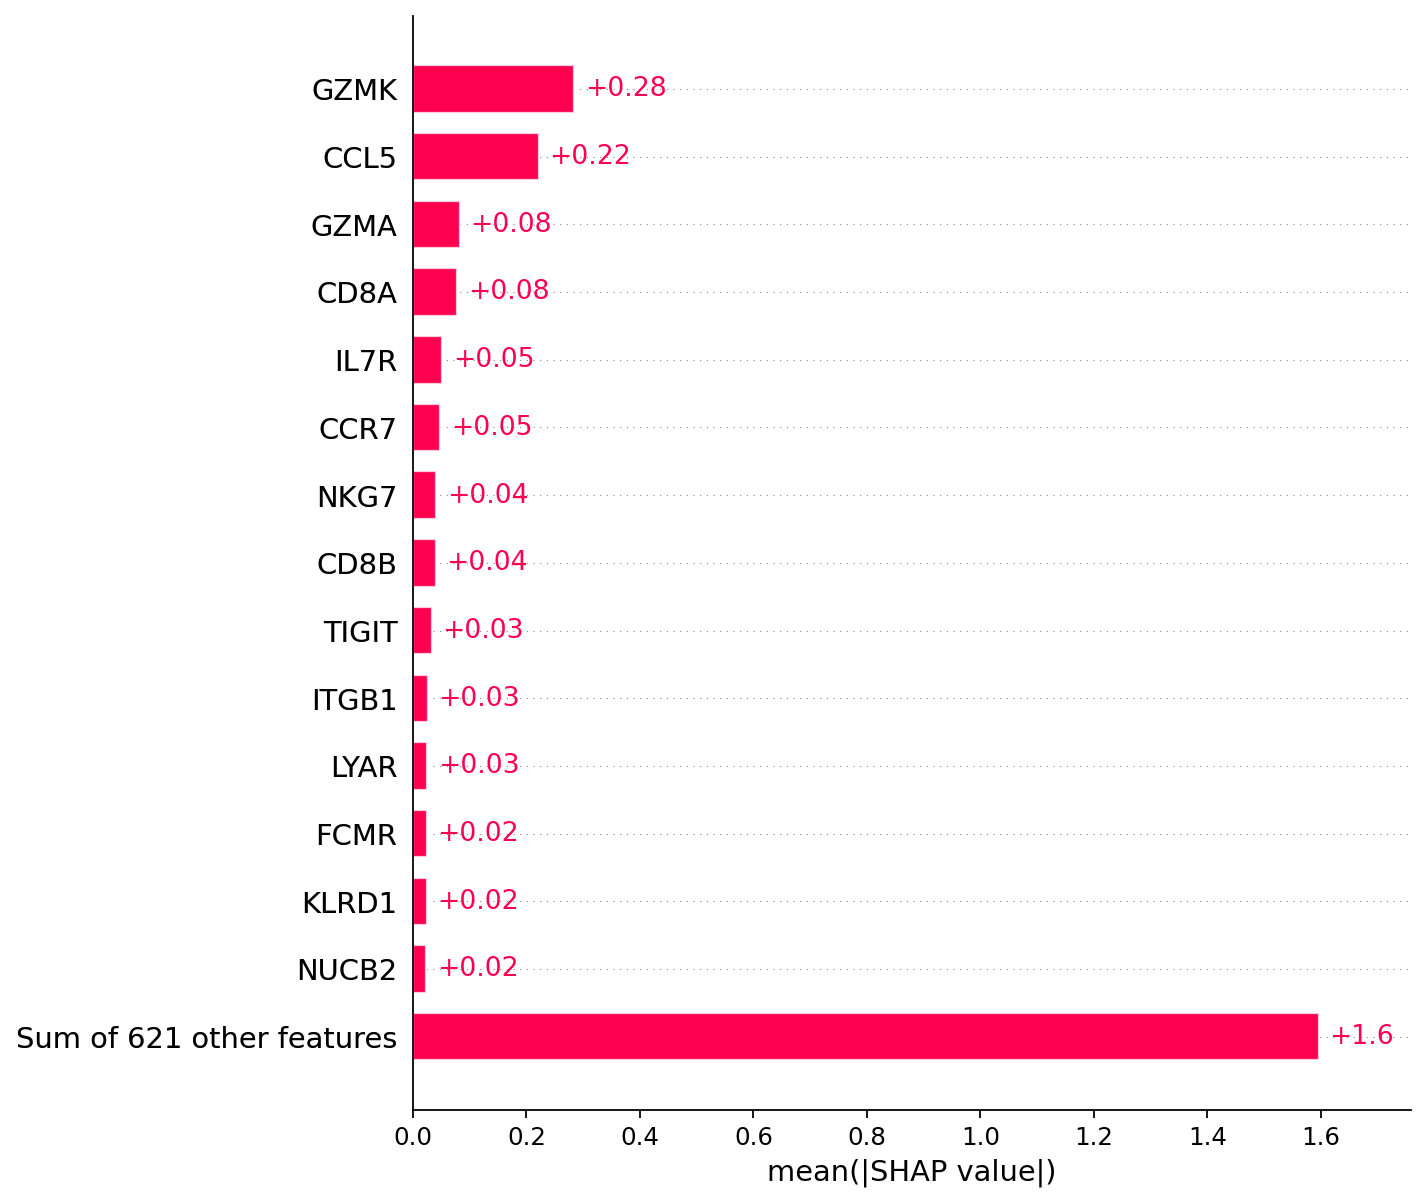
[17]:
# Visualization of explanations
# For the annotation of CD8+ T cells, the following genes are of the greatest importance:
plt.grid(visible=False, axis='both')
shap.plots.bar(explanations, max_display=15)
[18]:
# It is also possible to display SHAP values for individual cells
shap.plots.heatmap(explanations, max_display=15, show=False)
plt.grid(visible=False, axis='both')
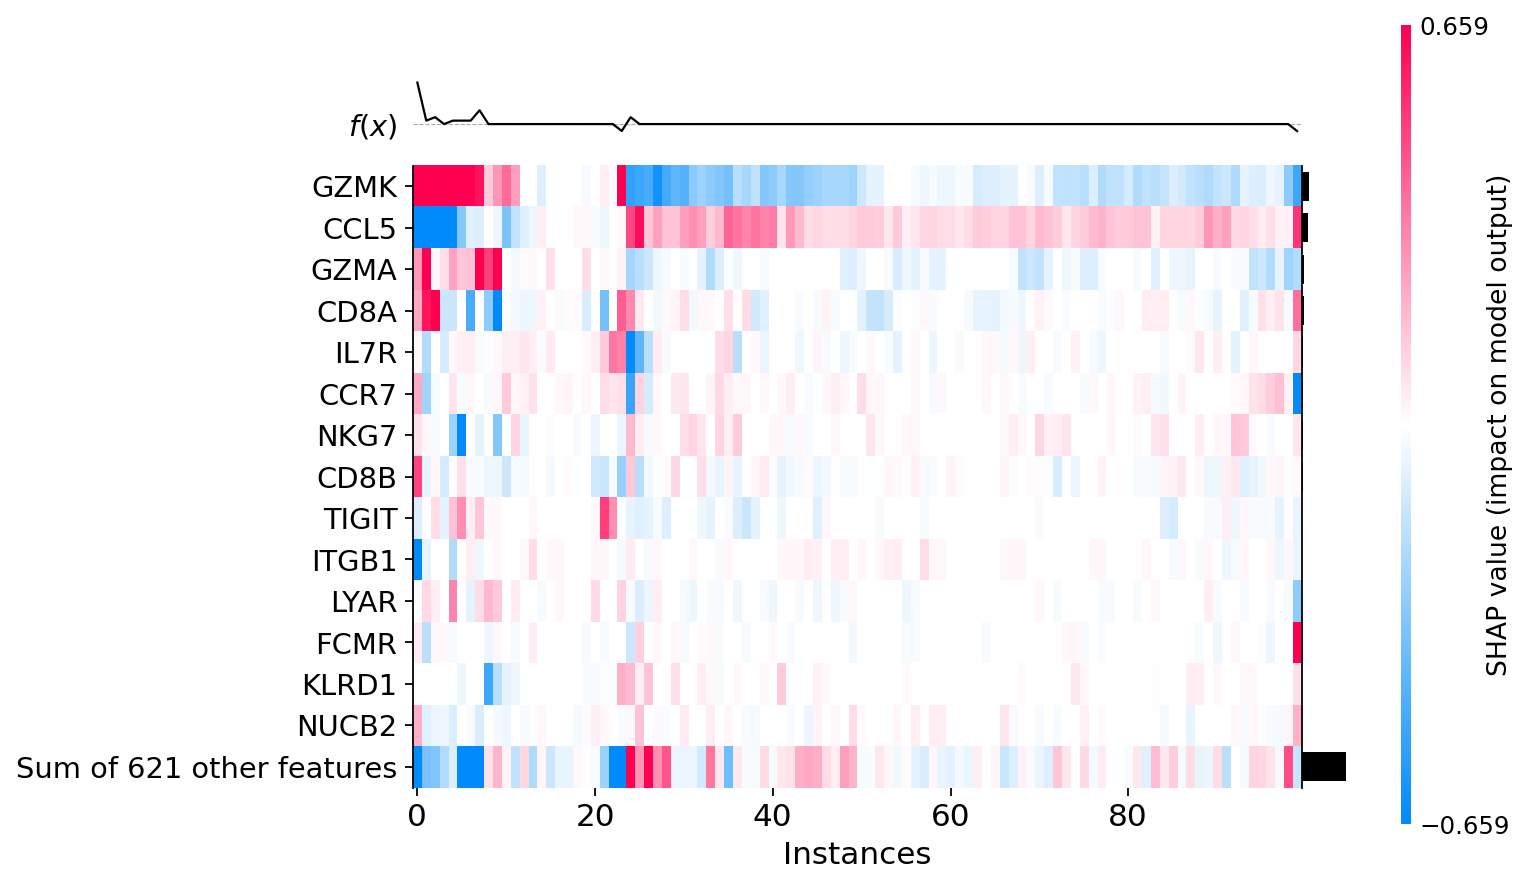
Difference between CD8+ T cells#
The difference in SHAP values indicates the presence of at least two different groups of CD8+ T cells. 1) Positive SHAP values of CCL5 and Negative SHAP values of GZMK 2) Positive or 0 SHAP values of GZMK and Negative or 0 SHAP values of CCL5 For individual cells, SHAP values can be displayed along with the levels of gene expression.
Warning! shap.plots.heatmap makes clusterization automatically. To find the cell number in explanations, it is necessary to perform a similar clustering using hclust. explanations.hclust() Then you can find the cell using the instance number from a shap.plots.heatmap.
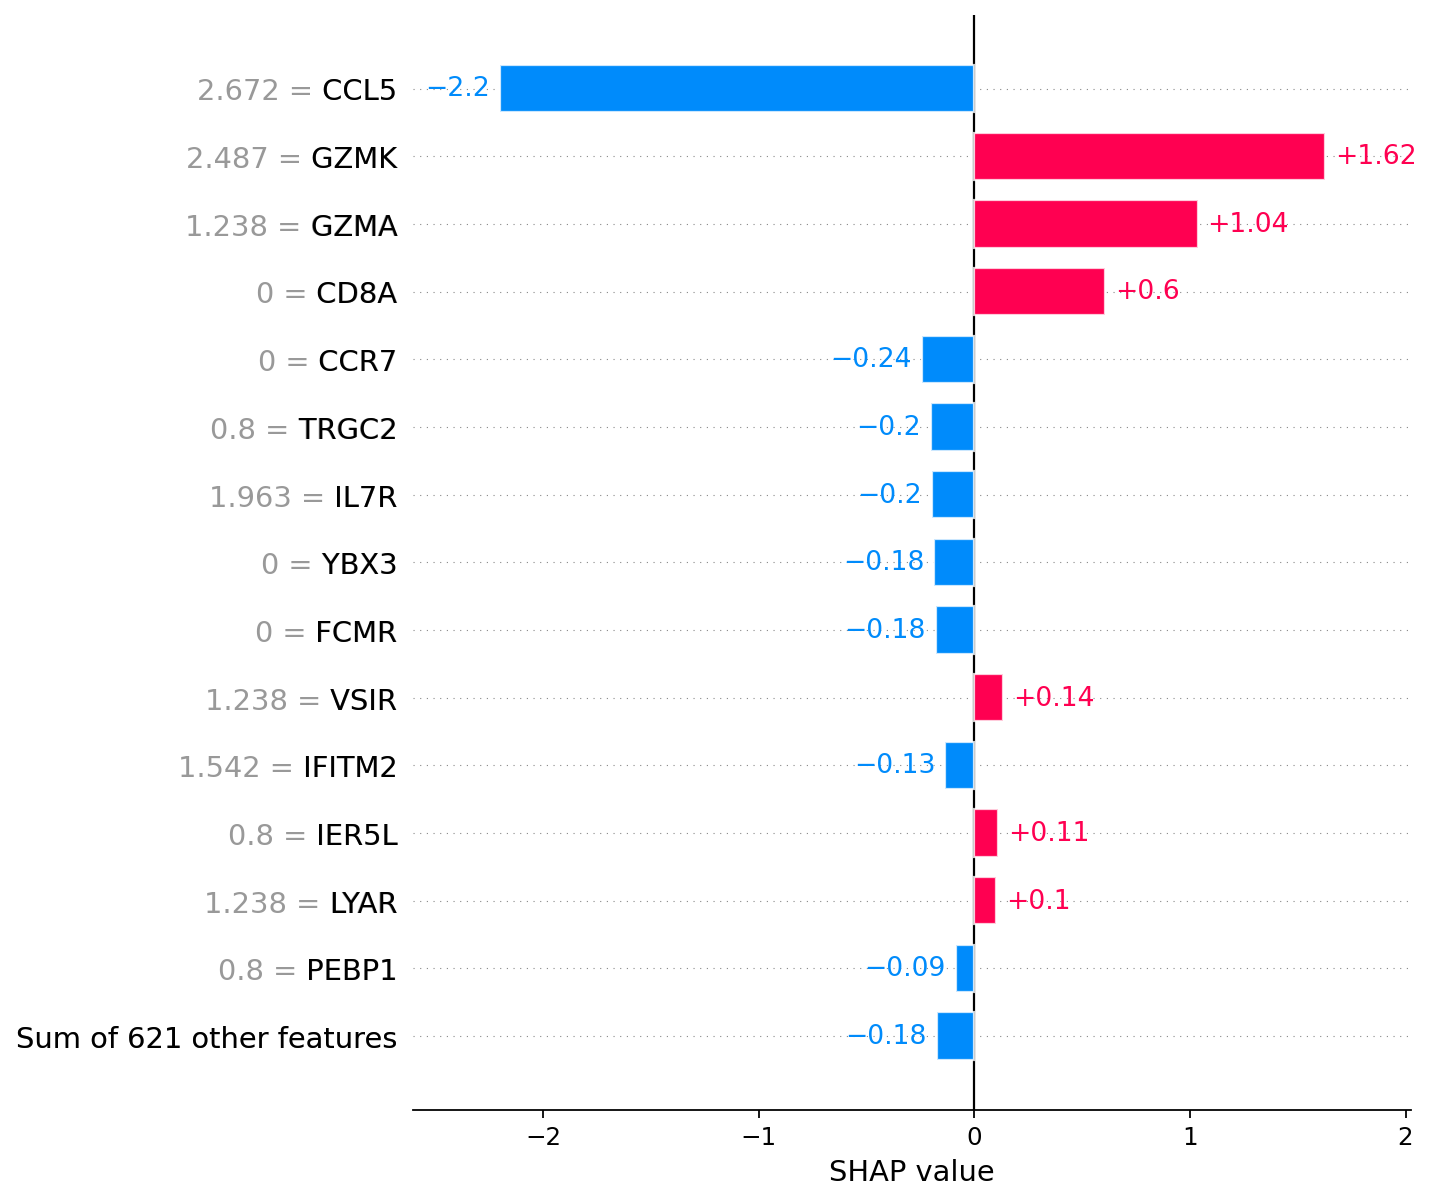
[19]:
# Memory CD8+ T cell
# Left column of numbers (near gene names) represents gene expression
shap.plots.bar(explanations[explanations.hclust()[1]], max_display=15, show=False)
plt.grid(visible=False, axis='both')
explanations.hclust()[1] # Actual cell from explanations
[19]:
5
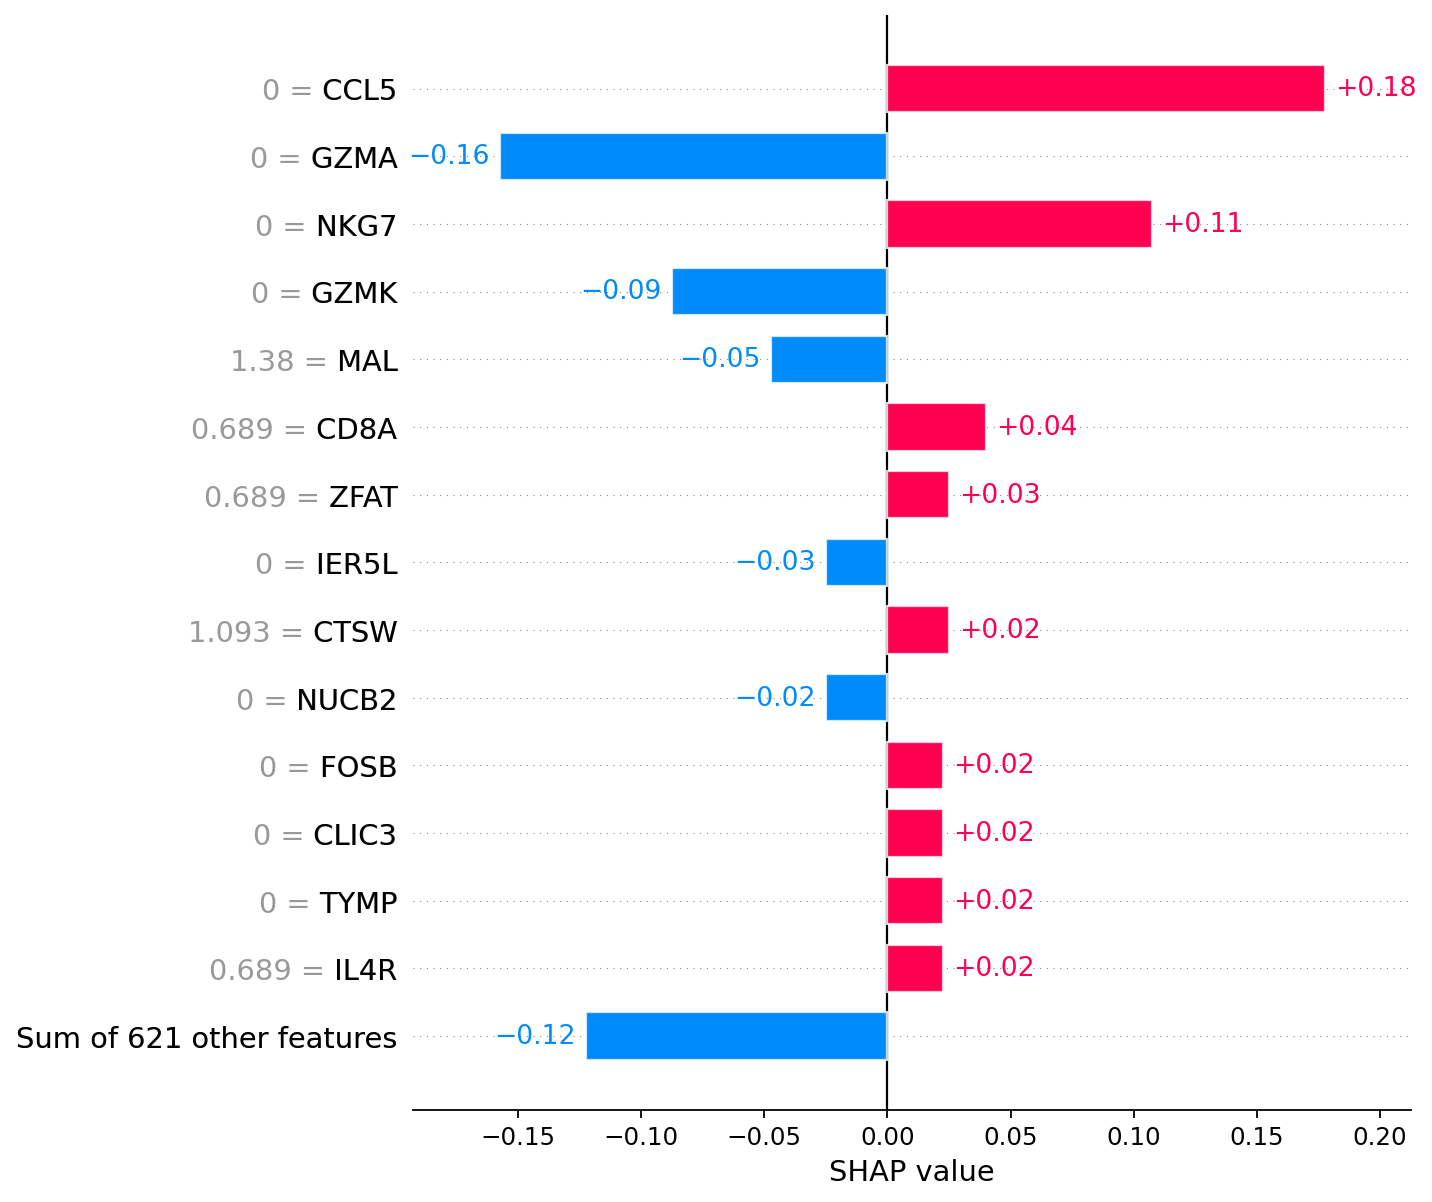
[20]:
# Naive CD8+ T cell
# Left column of numbers (near gene names) represents gene expression
shap.plots.bar(explanations[explanations.hclust()[70]], max_display=15, show=False)
plt.grid(visible=False, axis='both')
explanations.hclust()[70] # Actual cell from explanations
[20]:
91
For the annotation of cell 1, the most significant factors are the presence of GZMK and GZMA expression.
For the annotation of cell 70, the most significant factors are the absence of CCL5 and NKG7 expression.
[21]:
# Extract the same 100 cells from a dataset
adata_subset = adata[adata.obs['pred_celltype_l2'] == 'CD8 T'].copy()
indexes = pd.DataFrame(index = adata_subset.obs_names).sample(n = num_cells, axis = 0, random_state = random_state).index.tolist()
adata_subset = adata_subset[indexes]
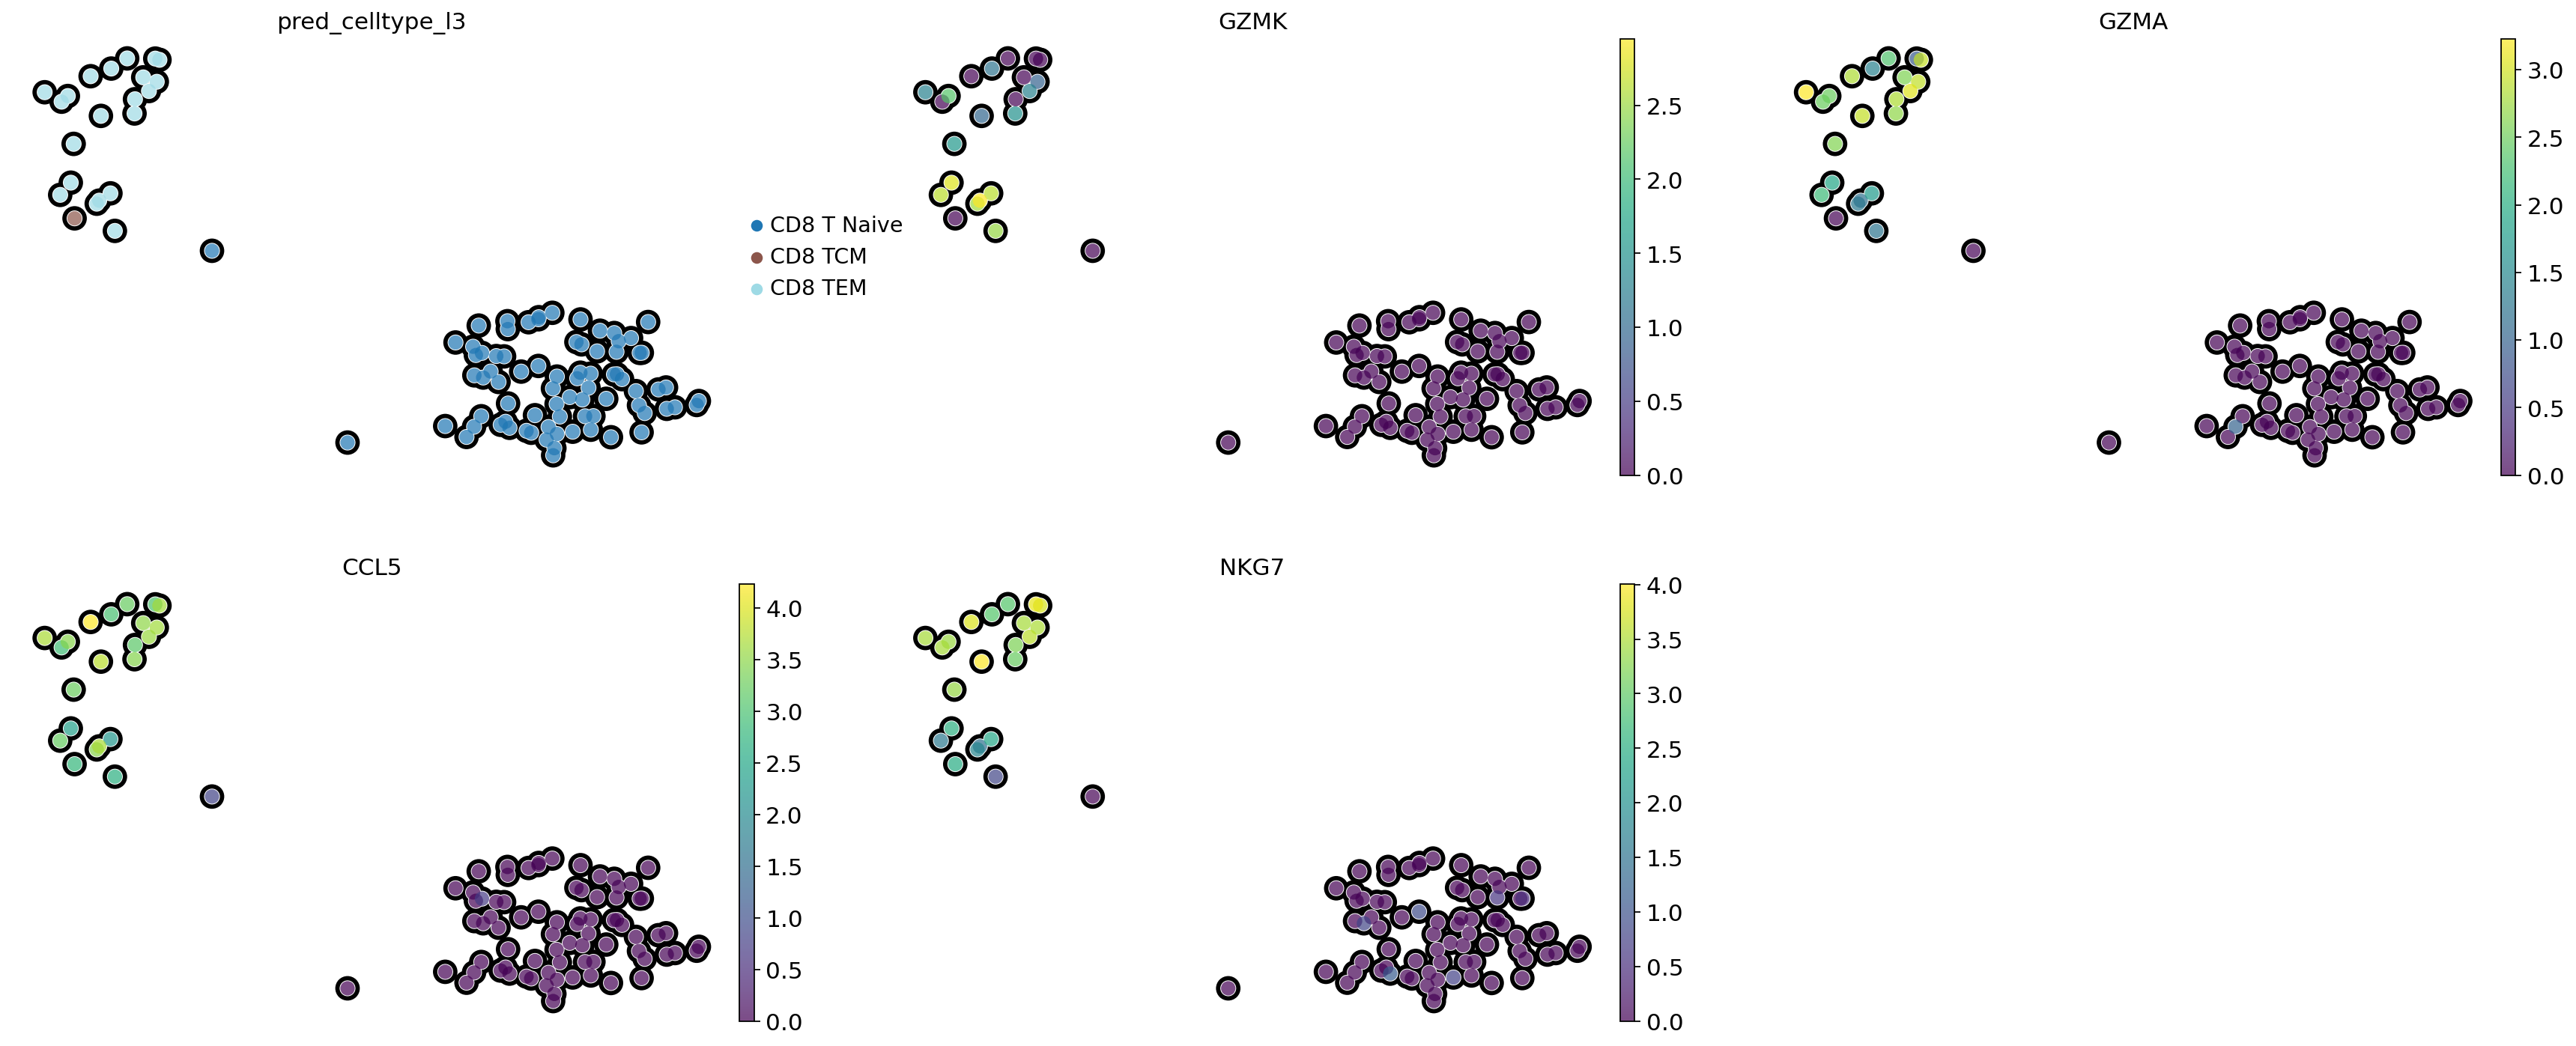
[22]:
# Visualization of gene importances on cell embeddings
# CD8 TCM - central memory
# CD8 TEM - effector memory
sc.pl.embedding(adata_subset,
                color = ['pred_celltype_l3',
                         'GZMK',
                         'GZMA',
                         'CCL5',
                         'NKG7'],
                basis = 'X_umap',
                frameon = False,
                add_outline = True,
                legend_loc = 'right margin',
                palette = 'tab20',
                ncols = 3,
                size = 300)
Marker gene search based on gene importances#
[23]:
# Compute explanations for plasmacytoid dendritic cells (pDC)
explanations  = scparadise.scnoah.explain(adata,
                                          celltype = 'pDC',
                                          num_cells = 75,
                                          path_model = 'Human_PBMC_scAdam/')
Successfully loaded list of genes used for training model
Successfully loaded dictionary of dataset annotations
Successfully loaded model
Cell type "pDC" was successfully selected from pred_celltype_l2
PermutationExplainer explainer: 76it [01:49, 1.61s/it]
The explanations for "pDC" have been completed
[24]:
# Calculate gene impoortances
gene_importances = scparadise.scnoah.feature_importance(explanations,
                                                         path_model = 'Human_PBMC_scAdam/')
# Show 10 most important genes for pDC cell annotation
gene_importances.head(10)
[24]:
| gene_name | gene_importance | |
|---|---|---|
| 507 | LINC00996 | 0.003733 |
| 449 | SMPD3 | 0.001244 |
| 258 | SERPINF1 | 0.001244 |
| 372 | GZMB | 0.001244 |
| 283 | GAS6 | 0.001244 |
| 562 | HLA-DQA1 | 0.001244 |
| 344 | PTCRA | 0.001244 |
| 125 | TSPAN13 | 0.001244 |
| 91 | APP | 0.001244 |
| 318 | AXL | 0.001244 |
[25]:
# Visualization of gene importances on cell embeddings
sc.pl.embedding(adata,
                color = gene_importances.head(16)['gene_name'],
                basis = 'X_umap',
                frameon = False,
                add_outline = True,
                size = 30,
                ncols = 4)
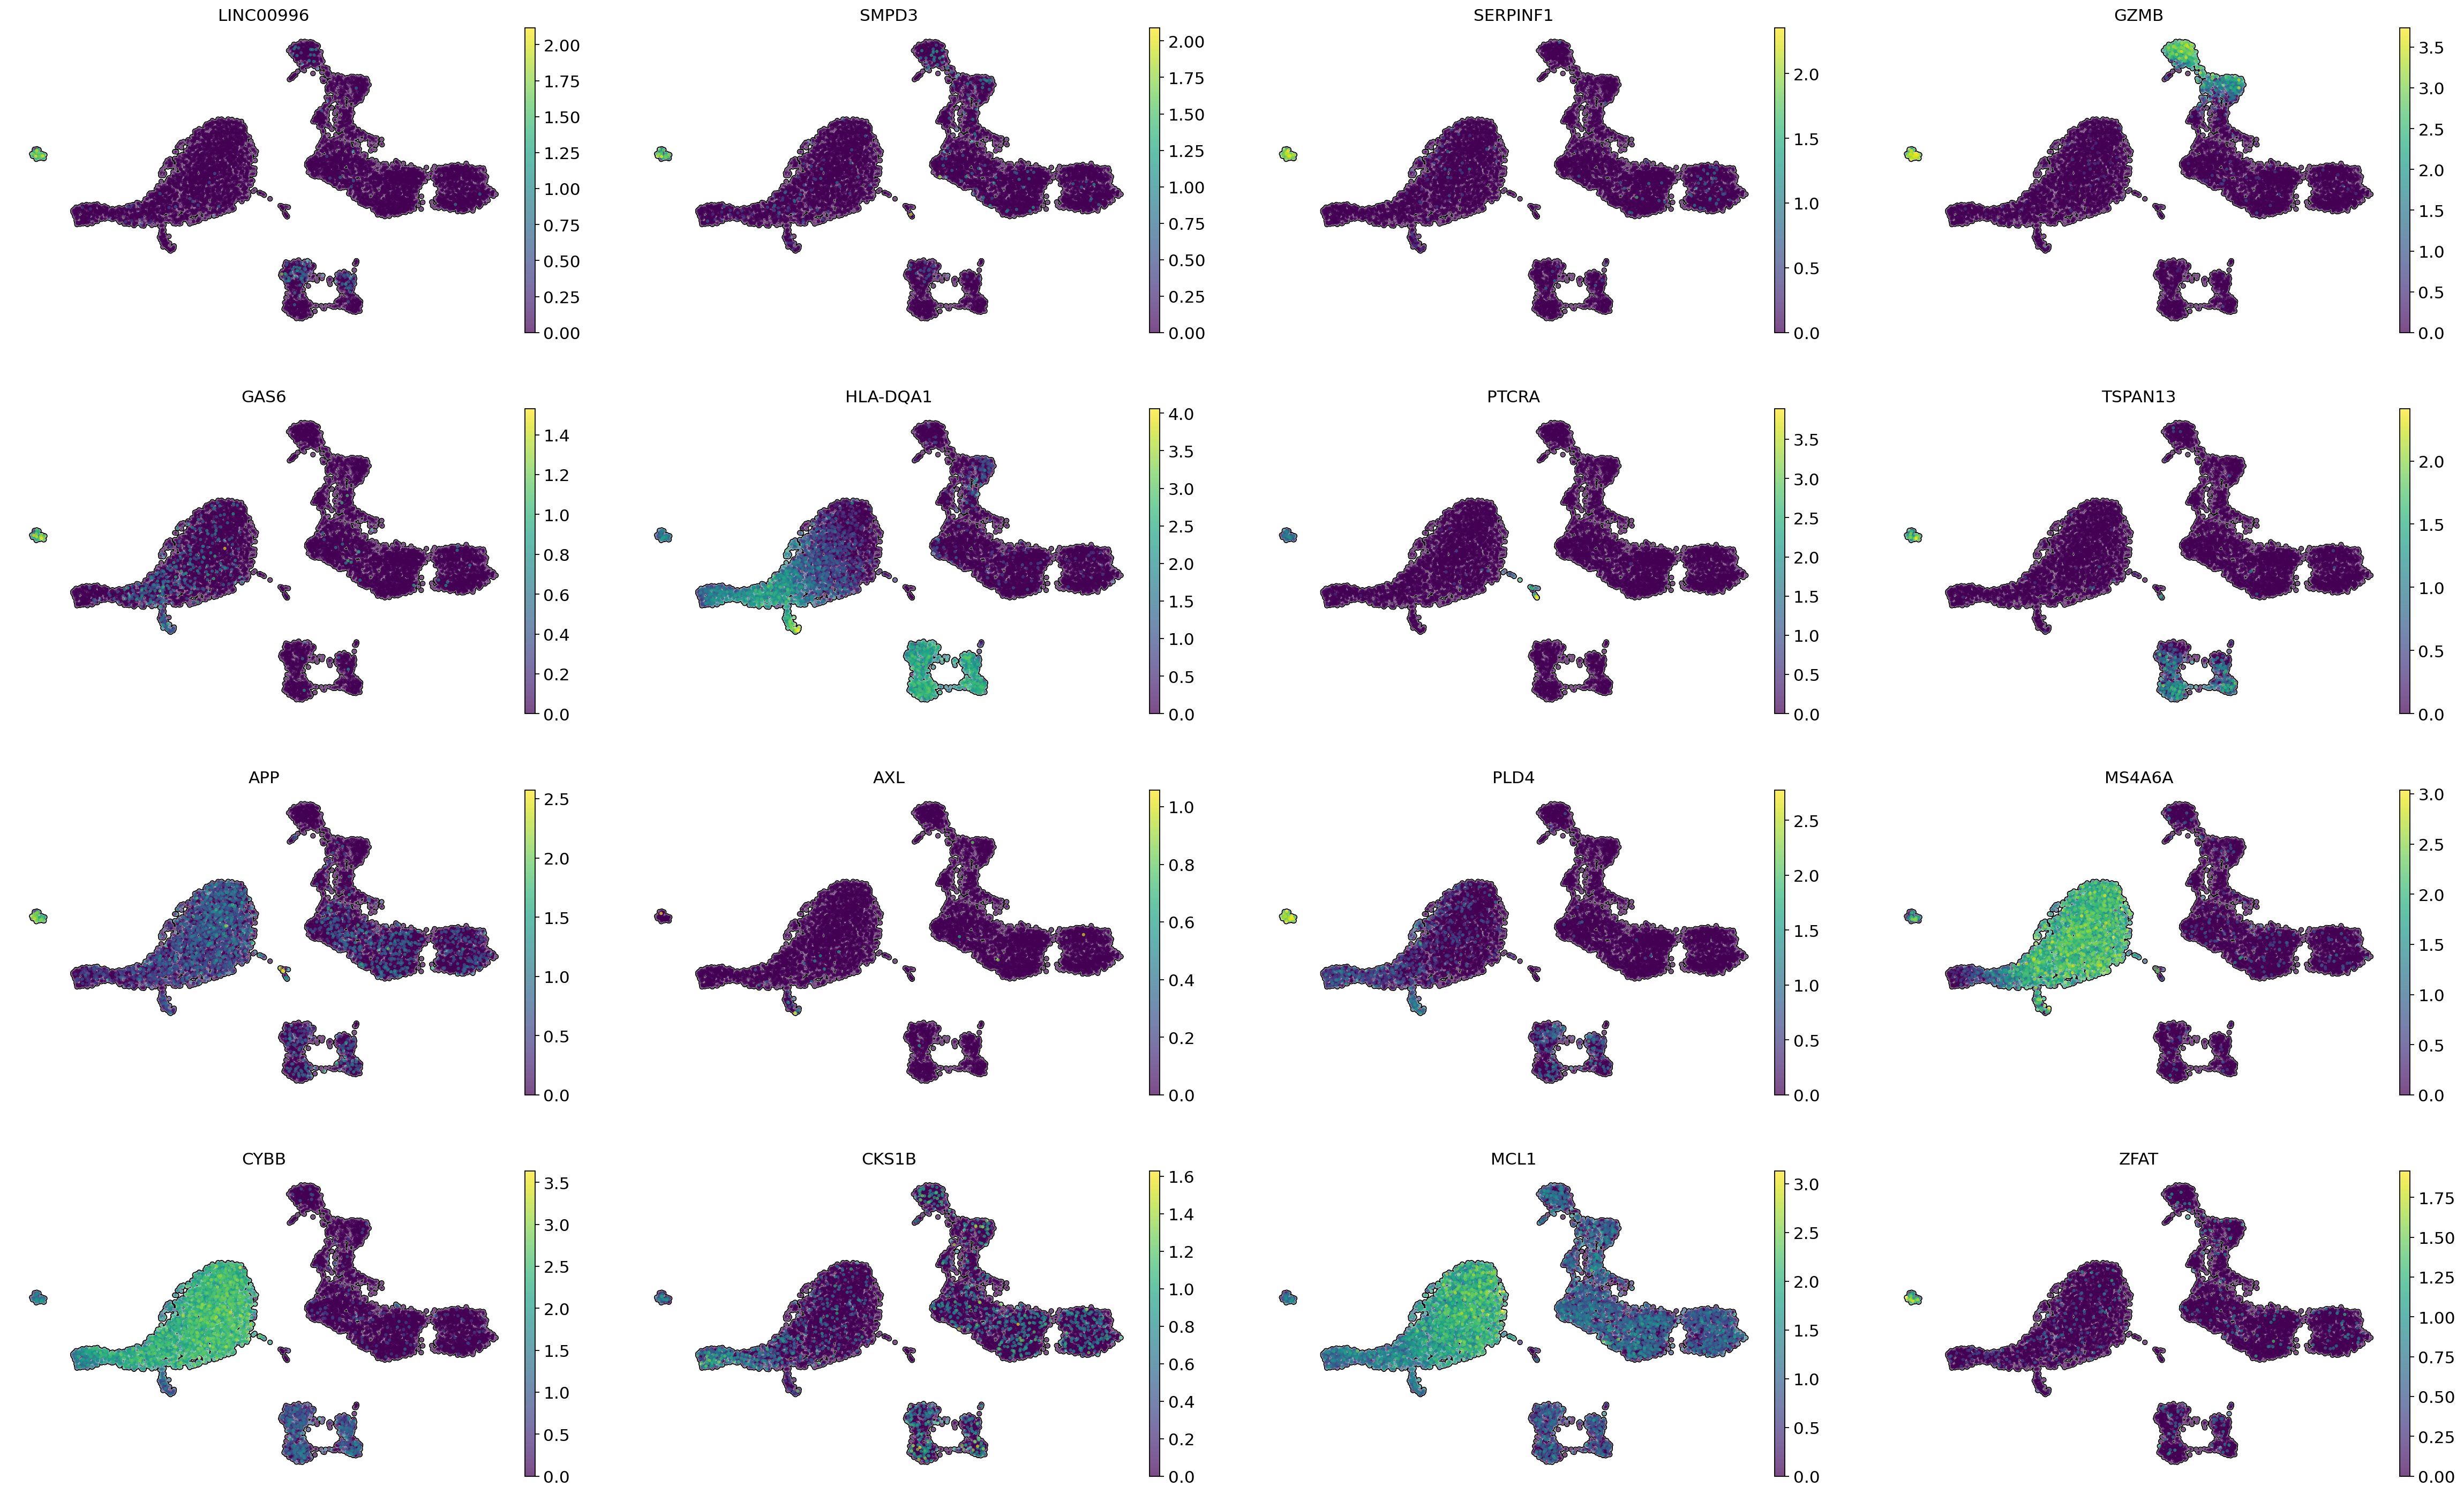
LINC00996, SMPD3, SERPINF1, GAS6, TSPAN13, APP, PLD4, and ZFAT, which have high gene importance values, can be considered marker genes for pDC.
[26]:
# Save anndata with predicted annotations
adata.write_h5ad('adata_predicted.h5ad')
[27]:
import session_info
session_info.show()
[27]:
Click to view session information
-----
anndata             0.10.8
matplotlib          3.9.2
numpy               1.25.0
pandas              2.2.3
scanpy              1.10.3
scparadise          0.3.1_beta
session_info        1.0.0
shap                0.46.0
-----
Click to view modules imported as dependencies
PIL                         10.4.0
anyio                       NA
arrow                       1.3.0
asciitree                   NA
asttokens                   NA
attr                        24.2.0
attrs                       24.2.0
awkward                     2.7.1
awkward_cpp                 NA
babel                       2.16.0
backports                   NA
certifi                     2024.08.30
cffi                        1.17.1
charset_normalizer          3.3.2
cloudpickle                 3.1.0
colorlog                    NA
comm                        0.2.2
cycler                      0.12.1
cython_runtime              NA
dask                        2024.8.0
dateutil                    2.9.0.post0
debugpy                     1.8.6
decorator                   5.1.1
defusedxml                  0.7.1
exceptiongroup              1.2.2
executing                   2.1.0
fastjsonschema              NA
fqdn                        NA
fsspec                      2023.6.0
h5py                        3.12.1
idna                        3.10
igraph                      0.11.6
imblearn                    0.12.3
importlib_metadata          NA
importlib_resources         NA
ipykernel                   6.29.5
isoduration                 NA
jaraco                      NA
jedi                        0.19.1
jinja2                      3.1.4
joblib                      1.4.2
json5                       0.9.25
jsonpointer                 3.0.0
jsonschema                  4.23.0
jsonschema_specifications   NA
jupyter_events              0.10.0
jupyter_server              2.14.2
jupyterlab_server           2.27.3
kiwisolver                  1.4.7
lazy_loader                 0.4
legacy_api_wrap             NA
leidenalg                   0.10.2
llvmlite                    0.43.0
markupsafe                  2.1.5
matplotlib_inline           0.1.7
more_itertools              10.5.0
mpl_toolkits                NA
msgpack                     1.1.0
mudata                      0.2.4
muon                        0.1.6
natsort                     8.4.0
nbformat                    5.10.4
numba                       0.60.0
numcodecs                   0.12.1
optuna                      4.0.0
overrides                   NA
packaging                   24.1
parso                       0.8.4
patsy                       0.5.6
pexpect                     4.9.0
platformdirs                4.3.6
plotly                      5.24.1
pooch                       v1.8.2
prometheus_client           NA
prompt_toolkit              3.0.48
psutil                      6.0.0
ptyprocess                  0.7.0
pure_eval                   0.2.3
pyarrow                     18.1.0
pycparser                   2.22
pydev_ipython               NA
pydevconsole                NA
pydevd                      3.1.0
pydevd_file_utils           NA
pydevd_plugins              NA
pydevd_tracing              NA
pydot                       3.0.3
pygments                    2.18.0
pynndescent                 0.5.13
pyparsing                   3.1.4
pythonjsonlogger            NA
pytorch_tabnet              NA
pytz                        2024.2
referencing                 NA
requests                    2.32.3
rfc3339_validator           0.1.4
rfc3986_validator           0.1.1
rich                        NA
rpds                        NA
scipy                       1.13.1
seaborn                     0.13.2
send2trash                  NA
setuptools                  75.1.0
setuptools_scm              NA
six                         1.16.0
skimage                     0.24.0
sklearn                     1.5.2
slicer                      NA
sniffio                     1.3.1
stack_data                  0.6.3
statsmodels                 0.14.3
tblib                       3.0.0
texttable                   1.7.0
threadpoolctl               3.5.0
tlz                         0.12.1
tomli                       2.0.1
toolz                       0.12.1
torch                       2.4.1+cu121
torchgen                    NA
tornado                     6.4.1
tqdm                        4.66.5
traitlets                   5.14.3
typing_extensions           NA
umap                        0.5.6
uri_template                NA
urllib3                     1.26.20
wcwidth                     0.2.13
webcolors                   24.8.0
websocket                   1.8.0
yaml                        6.0.2
zarr                        2.18.2
zipp                        NA
zmq                         26.2.0
zoneinfo                    NA
-----
IPython             8.18.1
jupyter_client      8.6.3
jupyter_core        5.7.2
jupyterlab          4.2.5
-----
Python 3.9.19 (main, May  6 2024, 19:43:03) [GCC 11.2.0]
Linux-5.15.167.4-microsoft-standard-WSL2-x86_64-with-glibc2.35
-----
Session information updated at 2025-01-15 22:52