Predict cell types with the scAdam model hub#
scAdam is specifically developed for annotating cell types, especially focusing on rare cell types that may be underrepresented in the dataset.
Advantages
scAdam not only detects all cell types in any test dataset but also generates reproducible results, which is an important aspect for reliable biological interpretation.
It enables multitasking by allowing the researchers to extract individual cell types for targeted investigations.
Unknown cell type identification makes it possible to identify new cell types that are absent from the data on which the scAdam model was trained.
Integration with Other Tools: scAdam is part of a bigger toolkit that includes other tools, such as scEve for surface protein prediction and scNoah for benchmarking, making it a comprehensive solution for single-cell analysis.
[1]:
# Python packages
import warnings
warnings.simplefilter('ignore')

import scanpy as sc
import scparadise
import numpy as np
import pandas as pd
import matplotlib.pyplot as plt

sc.set_figure_params(dpi = 120)
Recommendations about dataset#
Our models trained using shifted logarithm normalized data. We recommend shifted logarithm data normalization method to proper usage of our models: sc.pp.normalize_total(adata, target_sum=None) sc.pp.log1p(adata) adata.raw = adata
[2]:
# Load dataset from 10x Genomics
url = "https://cf.10xgenomics.com/samples/cell-exp/6.1.0/10k_PBMC_3p_nextgem_Chromium_X/10k_PBMC_3p_nextgem_Chromium_X_filtered_feature_bc_matrix.h5"
adata = sc.read_10x_h5("dataset.h5", backup_url = url)
adata.var_names_make_unique()
adata
100%|██████████████████████████████████████████████████████████████████████████████| 37.7M/37.7M [00:04<00:00, 9.28MB/s]
[2]:
AnnData object with n_obs × n_vars = 11996 × 36601
    var: 'gene_ids', 'feature_types', 'genome'
QC#
Standard quality control from scanpy tutorial
[3]:
# mitochondrial genes, "MT-" for human, "Mt-" for mouse
adata.var["mt"] = adata.var_names.str.startswith("MT-")
# ribosomal genes
adata.var["ribo"] = adata.var_names.str.startswith(("RPS", "RPL"))
# hemoglobin genes
adata.var["hb"] = adata.var_names.str.contains("^HB[^(P)]")
[4]:
sc.pp.calculate_qc_metrics(
    adata, qc_vars=["mt", "ribo", "hb"], inplace=True, log1p=True
)
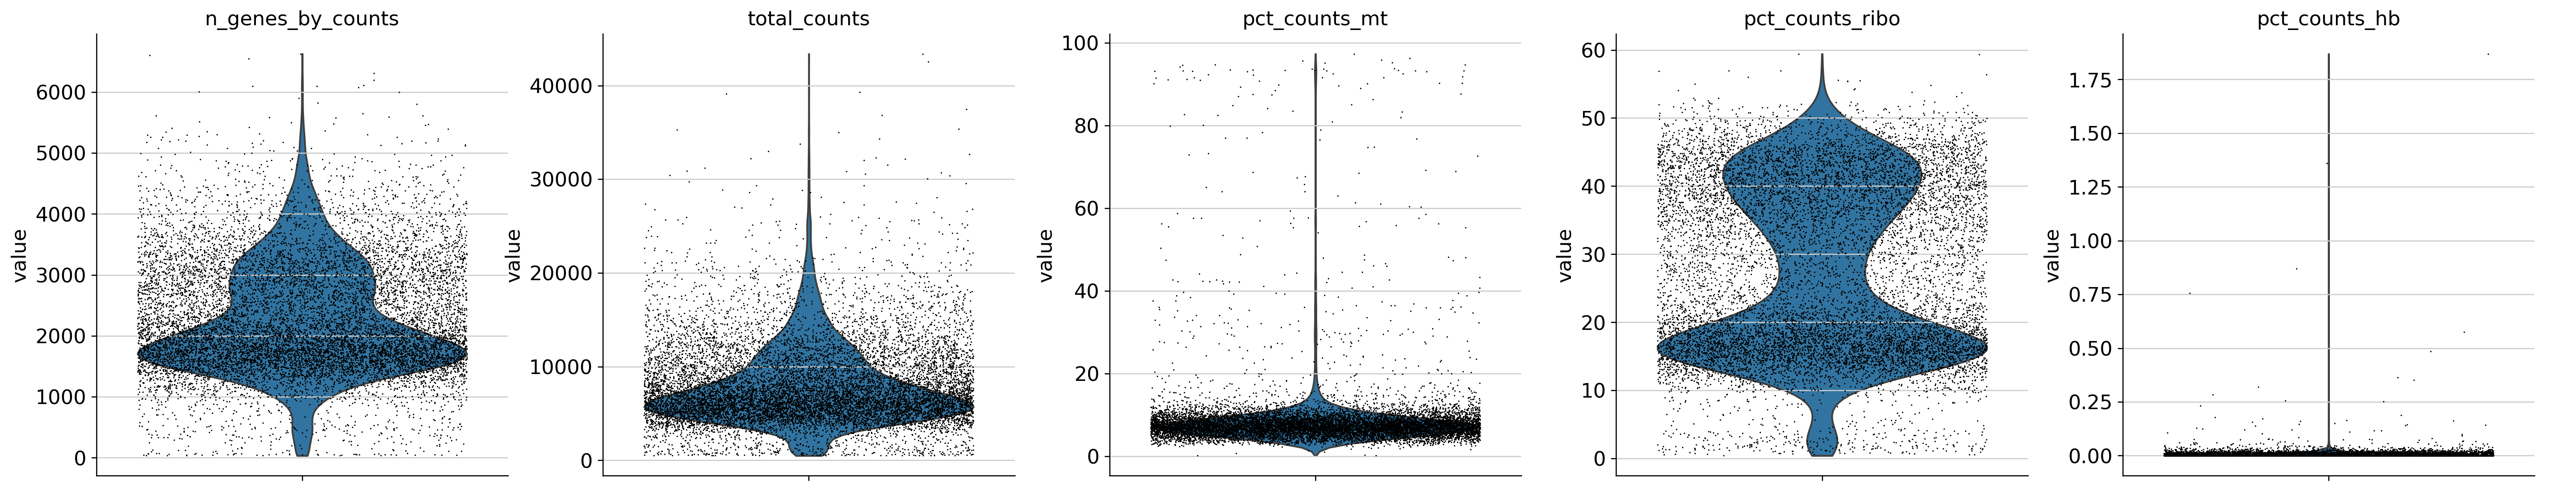
[5]:
sc.pl.violin(
    adata,
    ["n_genes_by_counts", "total_counts", "pct_counts_mt", 'pct_counts_ribo', 'pct_counts_hb'],
    jitter=0.4,
    multi_panel=True,
)
[6]:
sc.pp.filter_cells(adata, min_genes=200)
sc.pp.filter_genes(adata, min_cells=3)
[7]:
# Detect doublets
sc.pp.scrublet(adata)
[8]:
# Remove doublets + other QC metrics
adata = adata[adata.obs['predicted_doublet'] == False]
sc.pp.filter_cells(adata, max_genes = 5000)
sc.pp.filter_cells(adata, max_counts = 20000)
adata = adata[adata.obs['pct_counts_mt'] < 15]
Normalization, HVG, neighbors, PCA, UMAP#
We recommend using shifted logarithm data normalization as described here.
[9]:
# Saving count data
adata.layers["counts"] = adata.X.copy()
# Normalization (shifted logarithm)
sc.pp.normalize_total(adata, target_sum=None)
sc.pp.log1p(adata)
# scParadise use normalized data in adata.raw!!!
adata.raw = adata
# HVG
sc.pp.highly_variable_genes(adata, n_top_genes=2000)
# PCA
sc.tl.pca(adata)
# Nearest neighbors analysis
sc.pp.neighbors(adata, n_neighbors=10, n_pcs=20)
# UMAP
sc.tl.umap(adata)
scParadise prediction (scAdam)#
[10]:
# Available models for cell type annotation
df = scparadise.scadam.available_models()
# Show models related to humans
df_human = df[df['Tissue/Model name'].str.startswith('Human_')]
df_human
[10]:
| Tissue/Model name | Description | Suspension | Accuracy | Balanced Accuracy | Number of Levels | |
|---|---|---|---|---|---|---|
| 0 | Human_BMMC | Bone marrow mononuclear cell of healthy adults | cells | 0.947 | 0.942 | 3 |
| 1 | Human_Bone_Marrow | A Balanced Bone Marrow Reference | cells | 0.881 | 0.861 | 3 |
| 2 | Human_Brain_atlas | Human Brain Cell Atlas v1.0 | nuclei | 0.998 | 0.998 | 2 |
| 3 | Human_Brain_SEA_AD | Seattle Alzheimer’s Disease Brain Cell Atlas | nuclei | 0.997 | 0.997 | 3 |
| 4 | Human_CC_Dev_RNA | Multi-omic profiling of the developing human c... | nuclei | 0.974 | 0.975 | 2 |
| 5 | Human_CC_Dev_ATAC | Multi-omic profiling of the developing human c... | nuclei | 0.916 | 0.912 | 2 |
| 6 | Human_Heart | Human heart CITE-seq analysis of healthy and d... | cells | 0.957 | 0.956 | 2 |
| 7 | Human_Kidney_cell | scRNA-seq of the Adult Human Kidney (V. 1.5) | cells | 0.974 | 0.974 | 3 |
| 8 | Human_Kidney_nucleus | snRNA-seq of the Adult Human Kidney (V. 1.5) | nuclei | 0.973 | 0.972 | 3 |
| 9 | Human_Lung | Core Human Lung Cell Atlas | cells | 0.965 | 0.964 | 5 |
| 10 | Human_Lung_Cancer | Extended single-cell lung cancer atlas (LuCA) | cells | 0.937 | 0.936 | 3 |
| 11 | Human_oropharyngeal_SCC | Oropharyngeal HPV+/HPV- squamous cell carcinom... | cells | 0.972 | 0.968 | 2 |
| 12 | Human_Pancreas | Pancreatic islet atlas | cells | 0.996 | 0.989 | 1 |
| 13 | Human_PBMC | Peripheral blood mononuclear cells of healthy ... | cells | 0.979 | 0.979 | 3 |
| 14 | Human_Retina_cell | Single cell atlas of the human retina | cells | 0.984 | 0.979 | 4 |
| 15 | Human_Retina_nucleus | Single nucleus atlas of the human retina | nuclei | 0.994 | 0.994 | 2 |
| 16 | Human_Subcutaneous_AT | Subcutaneous adipose tissue atlas | cells | 0.973 | 0.954 | 3 |
| 17 | Human_Testes | Single cell atlas of the human testes | cells | 0.991 | 0.991 | 2 |
| 18 | Human_Visceral_AT | Visceral adipose tissue atlas | cells | 0.978 | 0.975 | 3 |
[11]:
# Download model for cell type prediction
scparadise.scadam.download_model('Human_PBMC', save_path='')
[12]:
# Predict cell types using trained model
adata = scparadise.scadam.predict(
    adata,
    path_model = 'Human_PBMC_scAdam'
)
scAdam model with unknown detector loaded from Human_PBMC_scAdam
Gene alignment:
  Model features: 947
  Matched features: 935 (98.7%)
Predicting: 100%|███████████████████████████████████████████████████████████████████████| 43/43 [00:00<00:00, 81.00it/s]
Added cell type column: pred_celltype_l1
Added probabilities column: pred_celltype_l1_probability
Added cell type column: pred_celltype_l2
Added probabilities column: pred_celltype_l2_probability
Added cell type column: pred_celltype_l3
Added probabilities column: pred_celltype_l3_probability
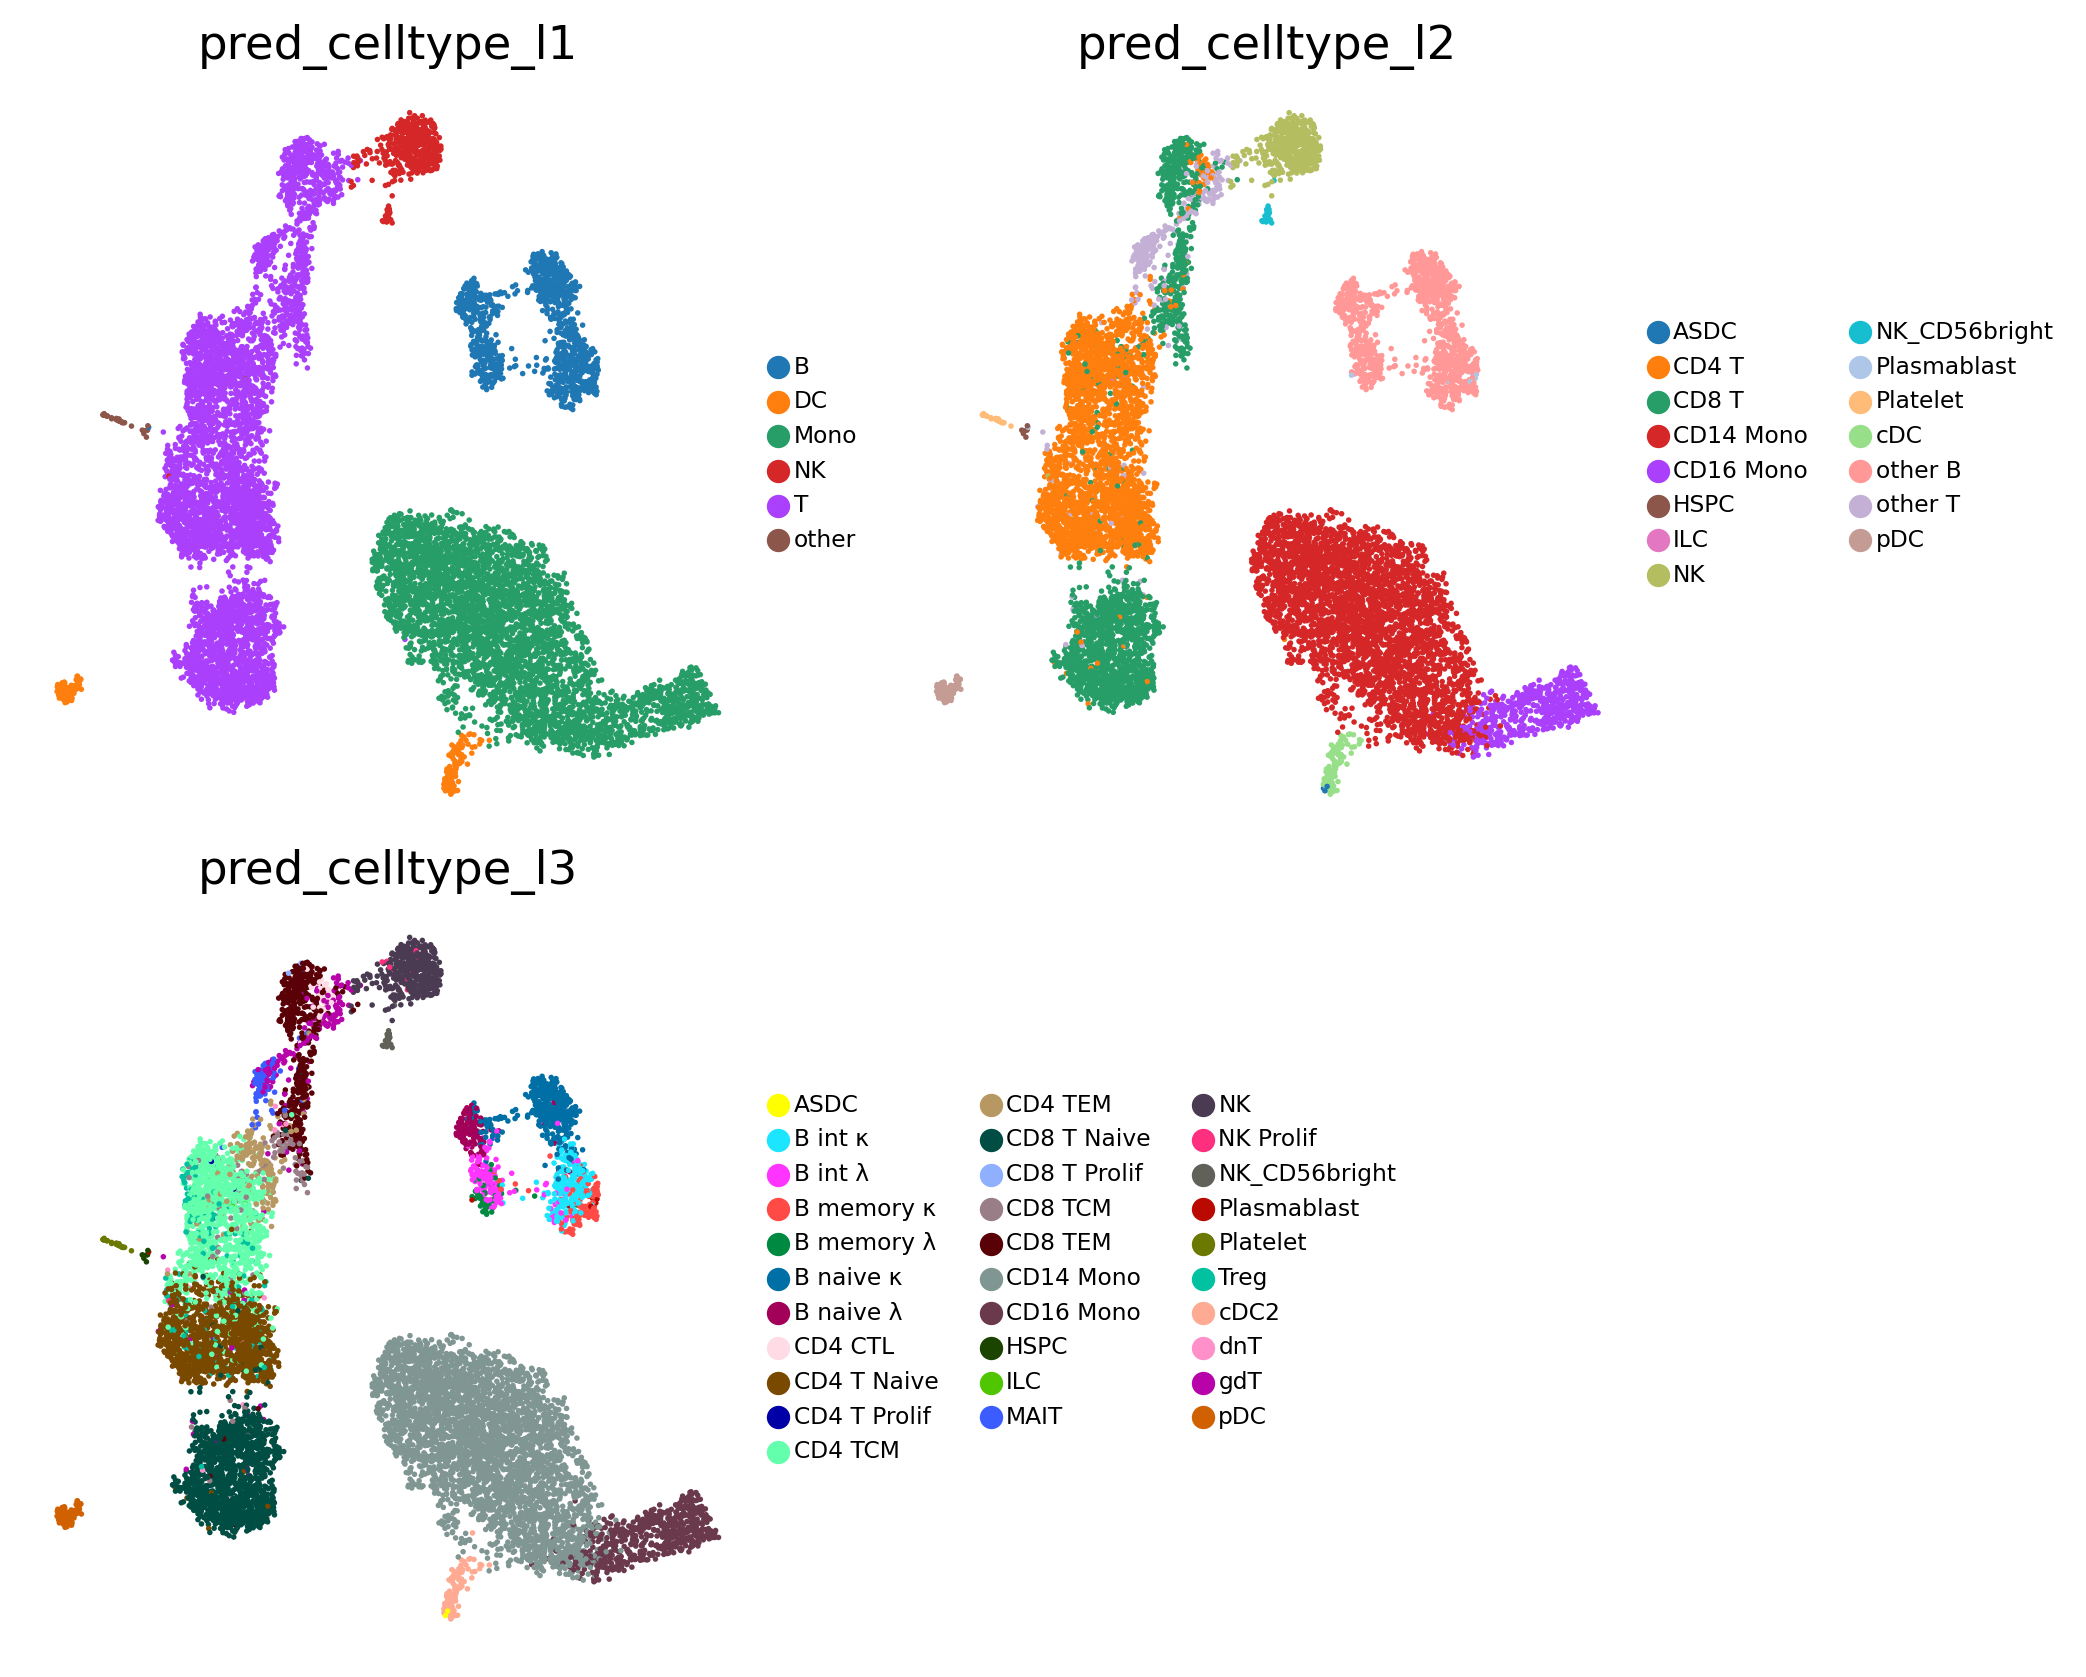
[13]:
# Visualise predicted cell types levels
sc.pl.embedding(
    adata,
    color = [
        'pred_celltype_l1',
        'pred_celltype_l2',
        'pred_celltype_l3',
    ],
    basis = 'X_umap',
    frameon = False,
    legend_loc = 'right margin',
    legend_fontsize = 7,
    ncols = 2,
    wspace = 0.1,
    hspace = 0.1
)
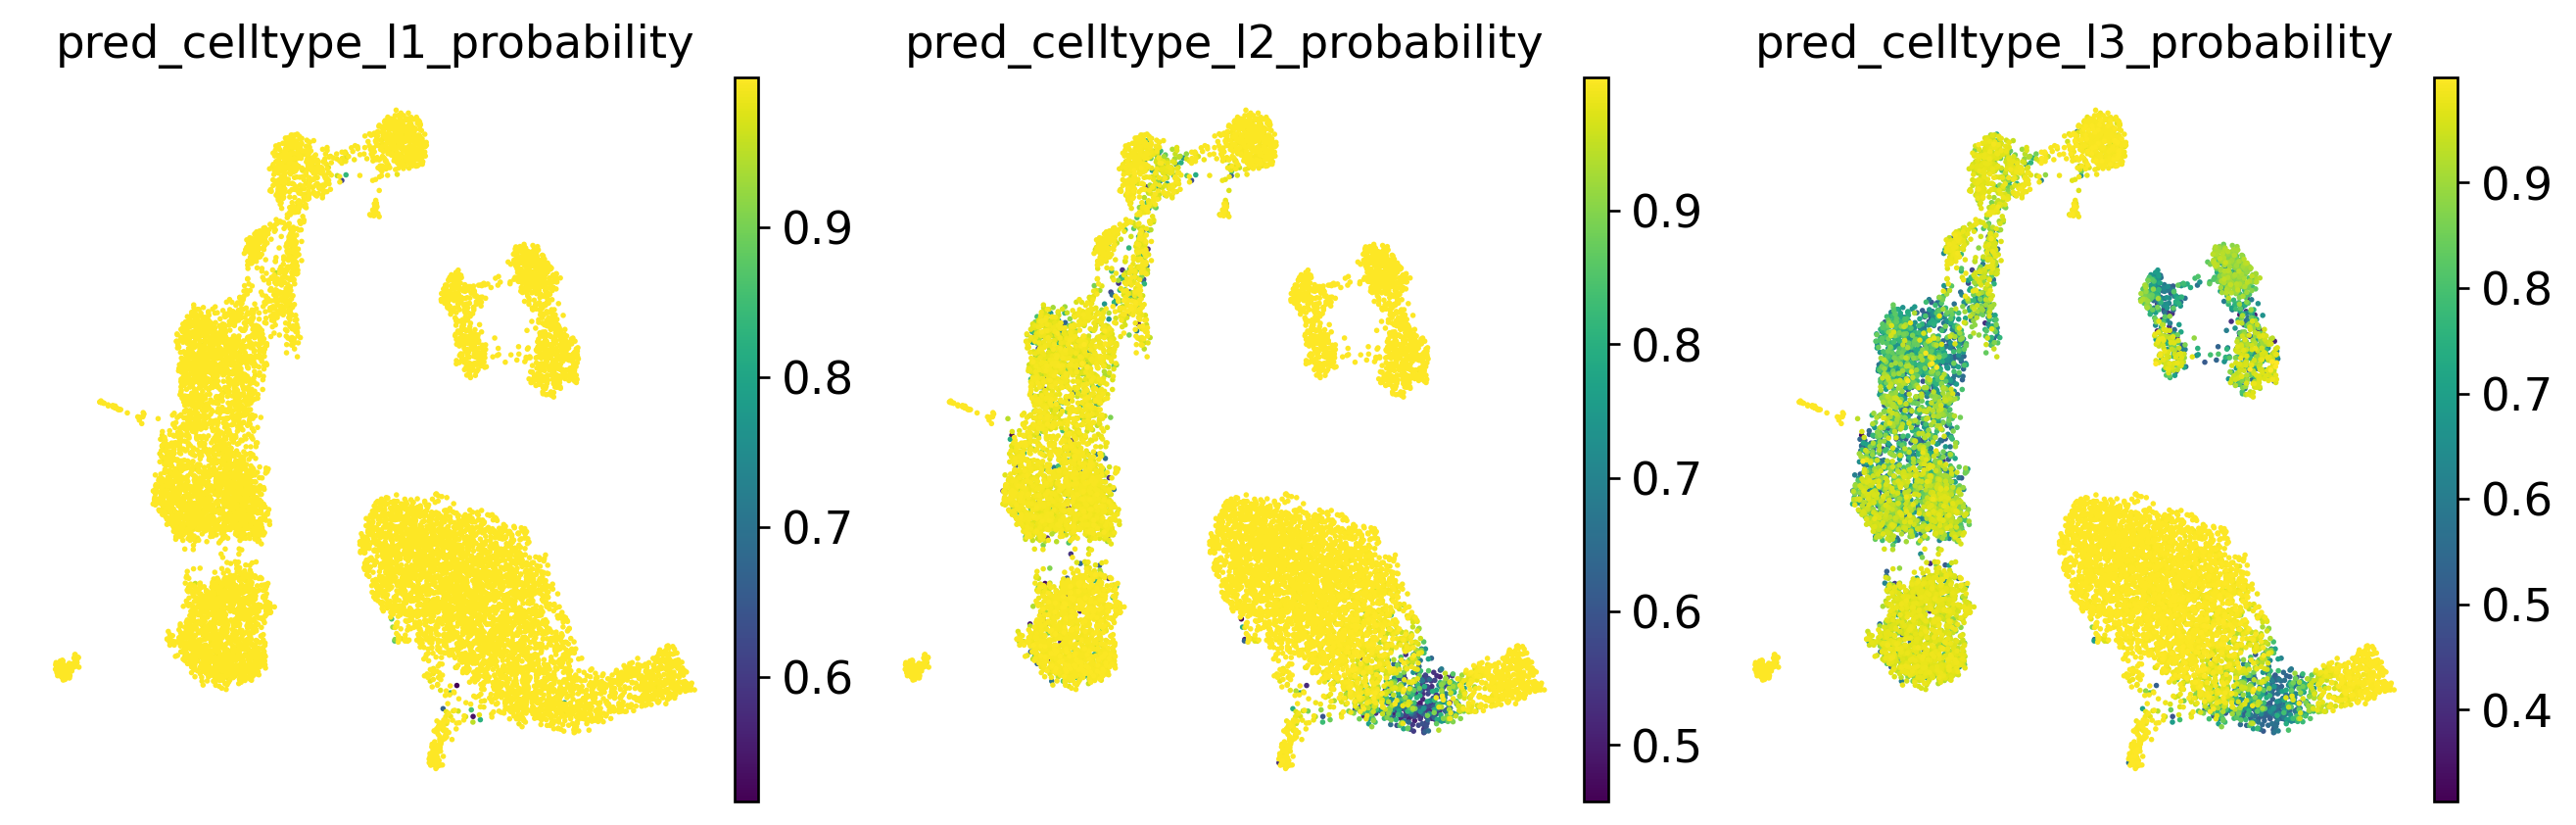
[14]:
# Visualise prediction probabilities
sc.pl.embedding(
    adata,
    color = [
        'pred_celltype_l1_probability',
        'pred_celltype_l2_probability',
        'pred_celltype_l3_probability',
    ],
    basis = 'X_umap',
    frameon = False,
    legend_loc = 'right margin',
    legend_fontsize = 7,
    ncols = 3,
    wspace = 0.1,
    hspace = 0.1
)
Check prediction results#
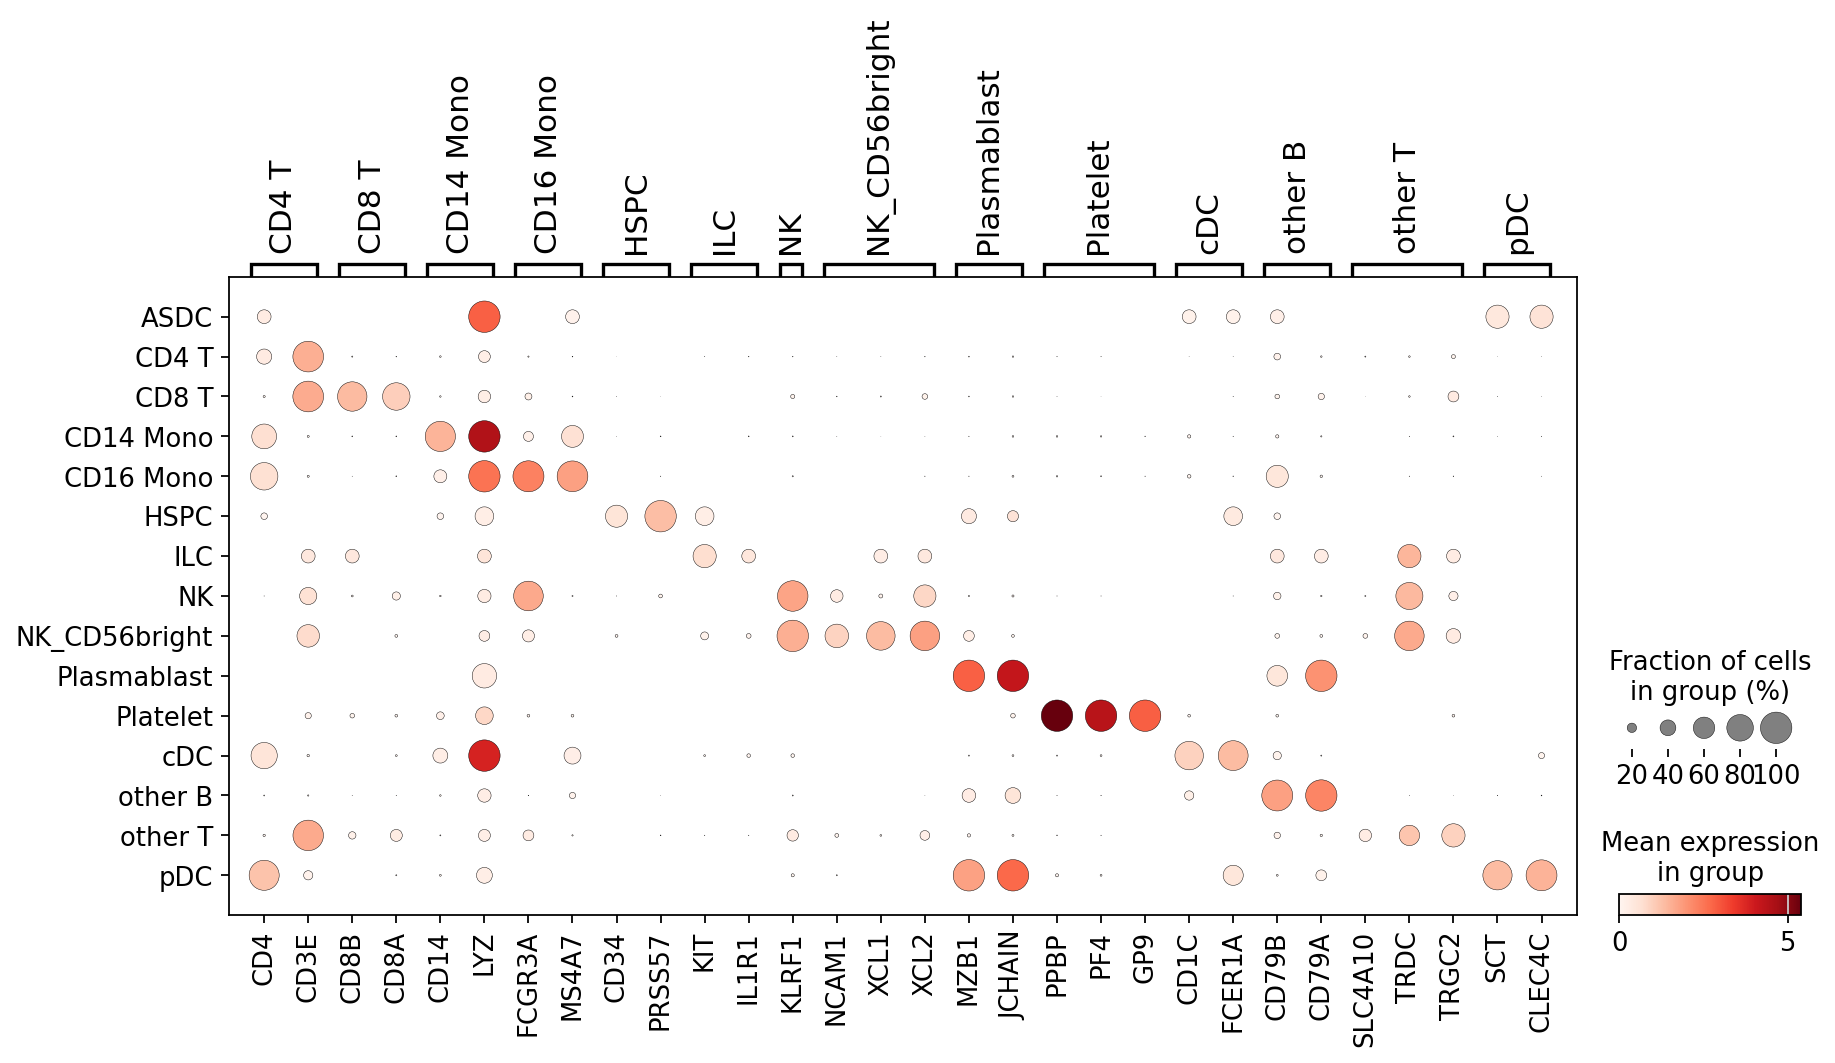
[15]:
# Visualization of marker genes of some predicted cell types
marker_genes = {
    "CD4 T" : ['CD4', 'CD3E'],
    "CD8 T" : ['CD8B', 'CD8A'],
    "CD14 Mono": ['CD14', 'LYZ'],
    "CD16 Mono": ['FCGR3A', 'MS4A7'],
    "HSPC": ['CD34', 'PRSS57'],
    "ILC": ['KIT', 'IL1R1'],
    "NK": ['KLRF1'],
    "NK_CD56bright": ['NCAM1', 'XCL1', 'XCL2'],
    "Plasmablast": ['MZB1', 'JCHAIN'],
    "Platelet": ['PPBP', 'PF4', 'GP9'],
    "cDC": ['CD1C', 'FCER1A'],
    "other B": ['CD79B', 'CD79A'],
    "other T": ['SLC4A10', "TRDC", 'TRGC2'],
    "pDC": ['SCT', 'CLEC4C'],
}
[16]:
# Dot plot
sc.set_figure_params(dpi = 80)
sc.pl.dotplot(adata, marker_genes, "pred_celltype_l2", dendrogram=False)
[17]:
# Make Axes
# Number of needed rows and columns (based on the row with the most columns)
nrow = len(marker_genes)
ncol = max([len(vs) for vs in marker_genes.values()])
fig, axs = plt.subplots(nrow, ncol, figsize=(4 * ncol, 4 * nrow))
# Plot expression for every marker on the corresponding Axes object
for row_idx, (cell_type, markers) in enumerate(marker_genes.items()):
    col_idx = 0
    for marker in markers:
        ax = axs[row_idx, col_idx]
        sc.pl.umap(
            adata,
            color=marker,
            ax=ax,
            show=False,
            cmap='bwr',
            frameon=False,
            ncols=3,
           # s=20
        )
        # Add cell type as row label - here we simply add it as ylabel of
        # the first Axes object in the row
        if col_idx == 0:
            # We disabled axis drawing in UMAP to have plots without background and border
            # so we need to re-enable axis to plot the ylabel
            ax.axis("on")
            ax.tick_params(
                top="off",
                bottom="off",
                left="off",
                right="off",
                labelleft="on",
                labelbottom="off",
            )
            ax.set_ylabel(cell_type + "\n", rotation=90, fontsize=14)
            ax.set(frame_on=False)
        col_idx += 1
    # Remove unused column Axes in the current row
    while col_idx < ncol:
        axs[row_idx, col_idx].remove()
        col_idx += 1
# Alignment within the Figure
fig.tight_layout()
[18]:
# Save anndata with predicted annotations
adata.write_h5ad('adata_predicted.h5ad')
[19]:
import session_info
session_info.show()
[19]:
Click to view session information
-----
anndata             0.11.4
matplotlib          3.10.8
numpy               2.2.6
pandas              2.3.3
scanpy              1.11.5
scparadise          1.0.0
session_info        v1.0.1
-----
Click to view modules imported as dependencies
81d243bd2c585b0f4821__mypyc NA
PIL                         12.1.1
aiohappyeyeballs            2.6.1
aiohttp                     3.13.3
aiosignal                   1.4.0
anyio                       NA
arrow                       1.4.0
asttokens                   NA
async_timeout               5.0.1
attr                        26.1.0
attrs                       26.1.0
babel                       2.18.0
certifi                     2026.02.25
cffi                        2.0.0
charset_normalizer          3.4.6
cloudpickle                 3.1.2
colorlog                    NA
comm                        0.2.3
cuda                        12.9.4
cycler                      0.12.1
cython_runtime              NA
dateutil                    2.9.0.post0
debugpy                     1.8.20
decorator                   5.2.1
defusedxml                  0.7.1
exceptiongroup              1.3.1
executing                   2.2.1
fastjsonschema              NA
fqdn                        NA
frozenlist                  1.8.0
fsspec                      2026.2.0
h5py                        3.16.0
idna                        3.11
imblearn                    0.14.1
ipykernel                   7.2.0
isoduration                 NA
jedi                        0.19.2
jinja2                      3.1.6
joblib                      1.5.3
json5                       0.13.0
jsonpointer                 3.1.0
jsonschema                  4.26.0
jsonschema_specifications   NA
jupyter_events              0.12.0
jupyter_server              2.17.0
jupyterlab_server           2.28.0
kiwisolver                  1.5.0
lark                        1.3.1
lazy_loader                 0.5
legacy_api_wrap             NA
llvmlite                    0.46.0
markupsafe                  3.0.3
matplotlib_inline           0.2.1
mpl_toolkits                NA
mudata                      0.3.3
multidict                   6.7.1
muon                        0.1.7
natsort                     8.4.0
nbformat                    5.10.4
numba                       0.64.0
optuna                      4.8.0
overrides                   NA
packaging                   25.0
parso                       0.8.6
patsy                       1.0.2
platformdirs                4.9.4
plottable                   0.1.5
prometheus_client           NA
prompt_toolkit              3.0.52
propcache                   0.4.1
psutil                      7.2.2
pure_eval                   0.2.3
pycparser                   3.00
pydev_ipython               NA
pydevconsole                NA
pydevd                      3.2.3
pydevd_file_utils           NA
pydevd_plugins              NA
pydevd_tracing              NA
pygments                    2.19.2
pynndescent                 0.6.0
pyparsing                   3.3.2
pythonjsonlogger            NA
pytorch_tabnet              NA
pytz                        2026.1.post1
referencing                 NA
requests                    2.32.5
rfc3339_validator           0.1.4
rfc3986_validator           0.1.1
rfc3987_syntax              NA
rpds                        NA
scipy                       1.15.3
seaborn                     0.13.2
send2trash                  NA
shap                        0.49.1
six                         1.17.0
skimage                     0.25.2
sklearn                     1.7.2
sklearn_compat              0.1.5
slicer                      NA
stack_data                  0.6.3
statsmodels                 0.14.6
threadpoolctl               3.6.0
torch                       2.10.0+cu128
torchgen                    NA
tornado                     6.5.5
tqdm                        4.67.3
traitlets                   5.14.3
typing_extensions           NA
umap                        0.5.11
uri_template                NA
urllib3                     2.6.3
wcwidth                     0.6.0
webcolors                   NA
websocket                   1.9.0
yaml                        6.0.3
yarl                        1.23.0
zmq                         27.1.0
zoneinfo                    NA
-----
IPython             8.38.0
jupyter_client      8.8.0
jupyter_core        5.9.1
jupyterlab          4.5.6
-----
Python 3.10.20 (main, Mar 11 2026, 17:46:40) [GCC 14.3.0]
Linux-6.6.87.2-microsoft-standard-WSL2-x86_64-with-glibc2.39
-----
Session information updated at 2026-03-23 10:13